

Question
Analyze the firm's financial statements from the past 3 years? Is the firm currently profitable? Is the division profitable? What debts and obligations is the
Analyze the firm's financial statements from the past 3 years? Is the firm currently profitable? Is the division profitable? What debts and obligations is the firm under? Is the analysis important to the firm's financial position now? How does this relate to Management?
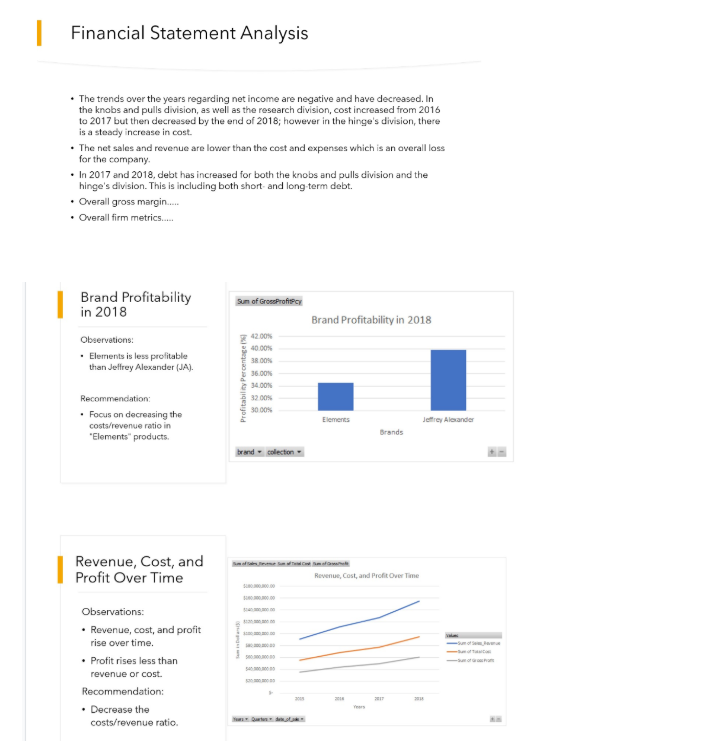
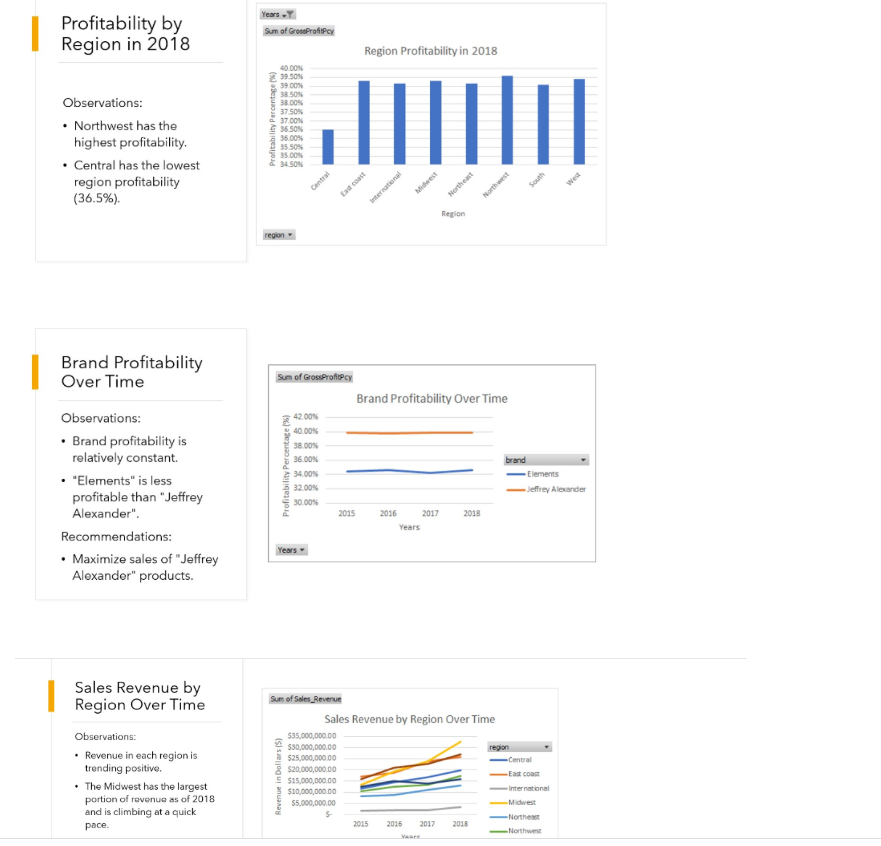
Financial Statement Analysis The trends over the years regarding net income are negative and have decreased. In the knobs and pulls division, as well as the research division, cost increased from 2016 to 2017 but then decreased by the end of 2018; however in the hinge's division, there is a steady increase in cost. The net sales and revenue are lower than the cost and expenses which is an overall loss for the company In 2017 and 2018, debt has increased for both the knobs and pulls division and the hinge's division. This is including both short and long-term debt. Overall gross margin..... Overall firm metrics..... Sun of GreeProfis Brand Profitability in 2018 Brand Profitability in 2018 S Observations: Elements is less profitable than Jeffrey Alexander (JA). & S Profitability Percentage 1 30.00% Recommendation: Focus on decreasing the costs/revenue ratio in "Elements products Elements Jefrey Aleander Brands brand collection- Revenue, Cost, and Profit Over Time Revenue, Cost, and Profit Over Time Observations: Revenue, cost, and profit rise over time. Profit rises less than revenue or cost Recommendation: Decrease the costs/revenue ratio. Years Profitability by Region in 2018 Sum of Gross Proficy Region Profitability in 2018 40.00% 39.50% 39.00% SON 38.00% 9 37 50% 37009 S3650% 35.00% 350 Observations: Northwest has the highest profitability. Central has the lowest region profitability (36.5%). 5 35.00 & SON ternational Midwest Northwest Region Brand Profitability Over Time Sum of GrossProfitPcy Brand Profitability Over Time 42.00% 38.00% 36.00% Profitability Percentage (3) 34.00 Observations: Brand profitability is relatively constant. . "Elements" is less profitable than "Jeffrey Alexander". Recommendations: Maximize sales of "Jeffrey Alexander" products. brand Elements Jeffrey Alexander 32.00% 30.00% 2015 2016 2017 2018 Sales Revenue by Region Over Time Sum of Sales Revenue Sales Revenue by Region Over Time $35,000,000.00 $30,000,000.00 $25,000,000.00 8 $20,000,000.00 $15,000,000.00 $10,000,000.00 $5,000,000.00 Observations: Revenue in each region is trending positive. The Midwest has the largest portion of revenue as of 2018 and is climbing at a quick pace. Central Revenue International Midwest Northe Northwest 2015 2016 2017 2018 Financial Statement Analysis The trends over the years regarding net income are negative and have decreased. In the knobs and pulls division, as well as the research division, cost increased from 2016 to 2017 but then decreased by the end of 2018; however in the hinge's division, there is a steady increase in cost. The net sales and revenue are lower than the cost and expenses which is an overall loss for the company In 2017 and 2018, debt has increased for both the knobs and pulls division and the hinge's division. This is including both short and long-term debt. Overall gross margin..... Overall firm metrics..... Sun of GreeProfis Brand Profitability in 2018 Brand Profitability in 2018 S Observations: Elements is less profitable than Jeffrey Alexander (JA). & S Profitability Percentage 1 30.00% Recommendation: Focus on decreasing the costs/revenue ratio in "Elements products Elements Jefrey Aleander Brands brand collection- Revenue, Cost, and Profit Over Time Revenue, Cost, and Profit Over Time Observations: Revenue, cost, and profit rise over time. Profit rises less than revenue or cost Recommendation: Decrease the costs/revenue ratio. Years Profitability by Region in 2018 Sum of Gross Proficy Region Profitability in 2018 40.00% 39.50% 39.00% SON 38.00% 9 37 50% 37009 S3650% 35.00% 350 Observations: Northwest has the highest profitability. Central has the lowest region profitability (36.5%). 5 35.00 & SON ternational Midwest Northwest Region Brand Profitability Over Time Sum of GrossProfitPcy Brand Profitability Over Time 42.00% 38.00% 36.00% Profitability Percentage (3) 34.00 Observations: Brand profitability is relatively constant. . "Elements" is less profitable than "Jeffrey Alexander". Recommendations: Maximize sales of "Jeffrey Alexander" products. brand Elements Jeffrey Alexander 32.00% 30.00% 2015 2016 2017 2018 Sales Revenue by Region Over Time Sum of Sales Revenue Sales Revenue by Region Over Time $35,000,000.00 $30,000,000.00 $25,000,000.00 8 $20,000,000.00 $15,000,000.00 $10,000,000.00 $5,000,000.00 Observations: Revenue in each region is trending positive. The Midwest has the largest portion of revenue as of 2018 and is climbing at a quick pace. Central Revenue International Midwest Northe Northwest 2015 2016 2017 2018
Step by Step Solution
There are 3 Steps involved in it
Step: 1

Get Instant Access to Expert-Tailored Solutions
See step-by-step solutions with expert insights and AI powered tools for academic success
Step: 2

Step: 3
Ace Your Homework with AI
Get the answers you need in no time with our AI-driven, step-by-step assistance
Get Started
Construction accounting and financial management
Authors: Steven j. Peterson
2nd Edition
135017114, 978-0135017111