

Answered step by step
Verified Expert Solution
Question
1 Approved Answer
Analyze the impact of: starting crews at an earlier time; converting storage bins so that they can be used for water-harvested berries; and installing new
Analyze the impact of: starting crews at an earlier time; converting storage bins so that they can be used for water-harvested berries; and installing new dryers.
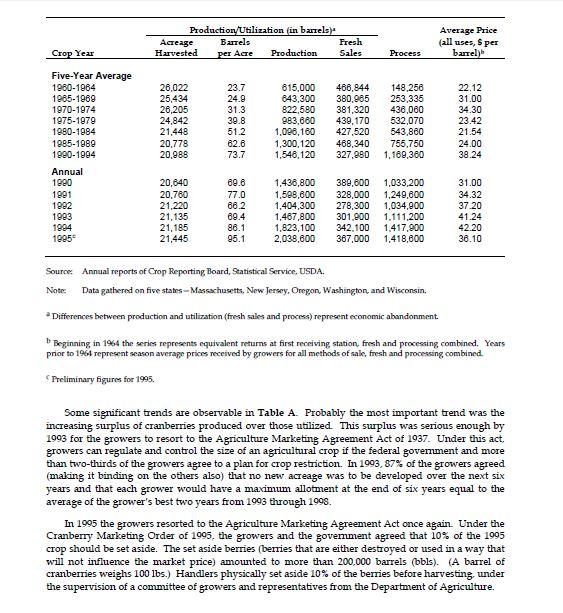
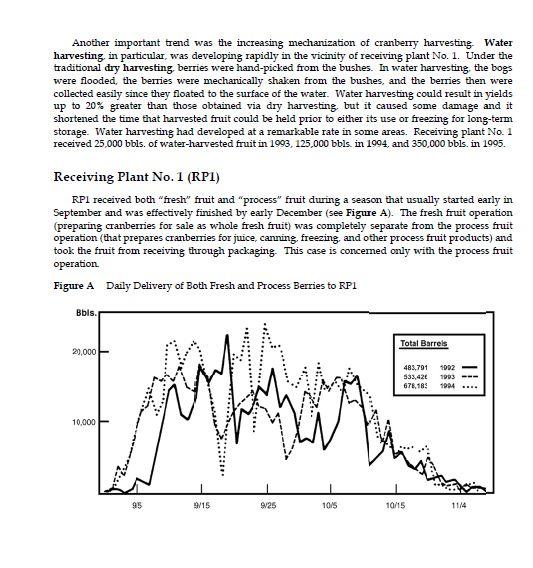
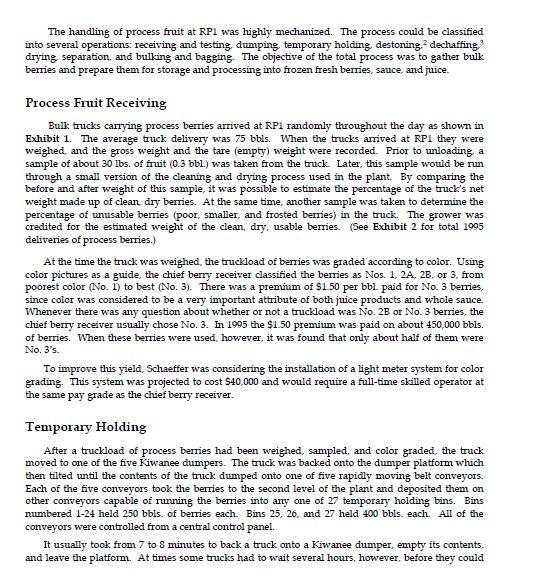
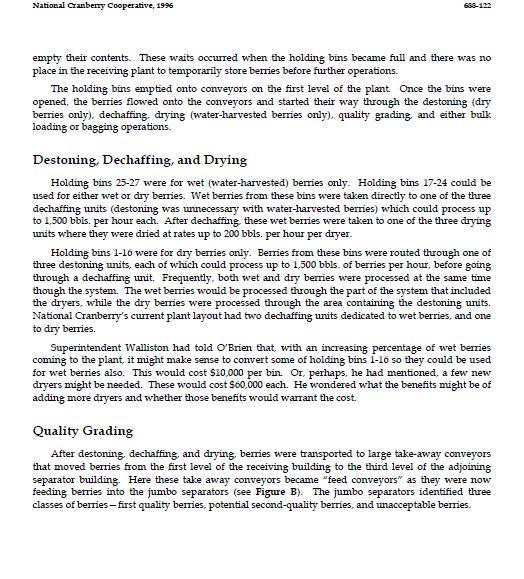
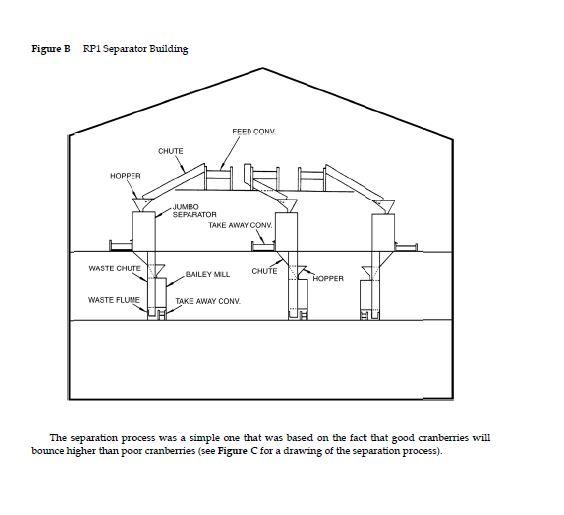
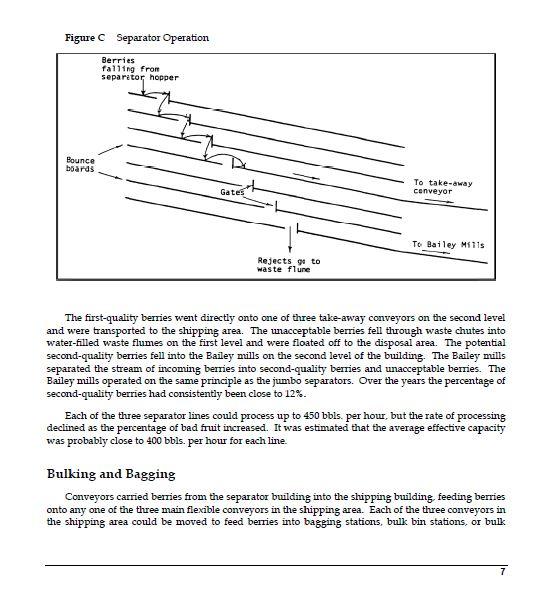
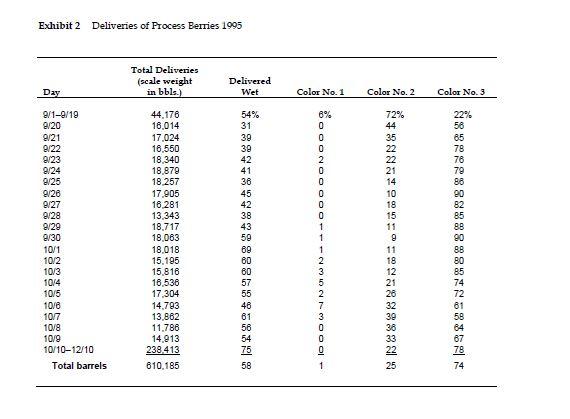
National Cranberry Cooperative, 1996 On February 14, 1996, Hugo Schaeffer, vice president of operations at the National Cranberry Cooperative (NCC), called his assistant, Mel O'Brien, into his office. Mel. I spent all day yesterday reviewing last fall's process fruit operations at receiving plant #1 [RP1] with Will Walliston, the superintendent, and talking with the co-op members (growers) in that area. It's obvious to me that we haven't solved our problems at that plant, yet. Even though we spent $200,000 last winter for a fifth Kiwanee dumper at RPI. our overtime costs were still out of control last fall, and the growers are still upset that their trucks and drivers had to spend so much time waiting to unload process fruit into the receiving plant. I can't blame them for being upset. They are the owners of this cooperative and they resent having to lease trucks and hire drivers to get the berries out of the field and then watch them stand idle, waiting to unload! Walliston thinks that the way to avoid these problems next fall is to increase our capacity by buying some new equipment I want you to go out there and take a hard look at the RP1 operation and find out what we need to do to improve operations before the 1996 crop comes in. We're going to have to move quickly if we are going to order new equipment, since the purchasing and installation lead times are in excess of six months. By the way, the growers in that region indicated that they plan on about the same size crop this year as last. But it looks like the percentage of water-harvested berries this year will increase to 70% of total process fruit from last year's 58%, which means that we'll have to change the way we schedule ou daily operations. NCC and the Cranberry Industry NCC was an organization formed and owned by growers of cranberries to process and market their berries. In recent years, 99% of all sales of cranberries were made by the various cooperatives active in the cranberry industry. NCC was one of the larger cooperatives and had operations in all the principal growing areas of North America: Massachusetts, New Jersey, Wisconsin, Washington. Oregon, British Columbia, and Nova Scotia Table A contains industry data for U.S. production and sales of cranberries. Production Utilization in barrels) Acreage Barrels Harvested Production Fresh Sales Average Price (all uses, per barrel) Crop Year per Acre Process Five-Year Average 1980-1984 1985-1989 1970-1974 1975-1979 1980-1984 1985-1989 1990-1994 Annual 1990 1991 1992 1993 1994 1995 26,022 25,434 26,205 24,842 21,448 20,778 20,988 23.7 24.9 31.3 39.8 51.2 62.6 73.7 615,000 643,300 822,580 983.680 1,096,180 1,300,120 1,548,120 466,844 380,985 381,320 439,170 427.520 468,340 327.980 148,256 253,335 438,080 532,070 543,860 755,750 1,169,360 22.12 31.00 34.30 23.42 21.54 24.00 38.24 20,640 20,760 21,220 21,135 21,185 21,445 89.6 77.0 66.2 69.4 86.1 1,436,800 1,588,600 1.404,300 1,487,800 1,823,100 2,038,600 389,800 328.000 278,300 301.900 342.100 367,000 1,033.200 1,249,800 1,034.000 1.111.200 1,417,900 1,418,600 31.00 34 32 3720 41.24 42.20 36.10 95.1 Source: Annual reports of Crop Reporting Board, Statistical Service. USDA. Note: Data gathered on five states -- Massachusetts, New Jersey, Oregon, Washington, and Wisconsin. Differences between production and utilization (fresh sales and process) represent economic abandonment. Beginning in 1964 the series represents equivalent returns at first receiving station, fresh and processing, combined. Years prior to 1964 represent season average prices received by growers for all methods of sale,fresh and processing combined. Preliminary figures for 1995 Some significant trends are observable in Table A. Probably the most important trend was the increasing surplus of cranberries produced over those utilized. This suplus was serious enough by 1993 for the growers to resort to the Agriculture Marketing Agreement Act of 1937. Under this act, growers can regulate and control the size of an agricultural crop if the federal government and more than two-thirds of the growers agree to a plan for crop restriction. In 1993, 87% of the growers agreed (making it binding on the others also) that no new acreage was to be developed over the next six years and that each grower would have a maximum allotment at the end of six years equal to the average of the grower's best two years from 1993 through 1998. In 1995 the growers resorted to the Agriculture Marketing Agreement Act once again. Under the Cranberry Marketing Order of 1995, the growers and the government agreed that 10% of the 1995 crop should be set aside. The set aside berries (berries that are either destroyed or used in a way that will not influence the market price) amounted to more than 200,000 barrels (bbls). (A barrel of cranberries weighs 100 lbs.) Handlers physically set aside 10% of the berries before harvesting, under the supervision of a committee of growers and representatives from the Department of Agriculture. Another important trend was the increasing mechanization of cranberry harvesting Water harvesting in particular, was developing rapidly in the vicinity of receiving plant No. 1. Under the traditional dry harvesting, berries were hand-picked from the bushes. In water harvesting, the bogs were flooded, the berries were mechanically shaken from the bushes, and the berries then were collected easily since they floated to the surface of the water. Water harvesting could result in yields up to 20% greater than those obtained via dry harvesting, but it caused some damage and it shortened the time that harvested fruit could be held prior to either its use or freezing for long-term storage. Water harvesting had developed at a remarkable rate in some areas. Receiving plant No. 1 received 25.000 bbls. of water-harvested fruit in 1993, 125,000 bbls. in 1994, and 350,000 bbls. in 1995. Receiving Plant No. 1 (RPI) RPI received both "fresh fruit and process" fruit during a season that usually started early in September and was effectively finished by early December (see Figure A). The fresh fruit operation (preparing cranberries for sale as whole fresh fruit) was completely separate from the process fruit operation (that prepares cranberries for juice, canning, freezing and other process fruit products) and took the fruit from receiving through packaging. This case is concerned only with the process fruit operation Figure A Daily Delivery of Both Fresh and Process Berries to RP1 Bbls. Total Barrets 29,000 483,701 533,426 678,18: 1002 1993 10,000 95 9/15 9/25 10/5 10/15 1114 The handling of process fruit at RPI was highly mechanized. The process could be classified into several operations receiving and testing, dumping temporary holding destoning? deshaffing drying separation and bulking and bagging. The objective of the total process was to gather bulk berries and prepare them for storage and processing into frozen fresh berries, sauce, and juice. Process Fruit Receiving Bulk trucks carrying process berries arrived at RPI randomly throughout the day as shown in Exhibit 1. The average truck delivery was 75 bbls. When the trucks arrived at RP1 they were weighed, and the gross weight and the tare (empty) weight were recorded. Prior to unloading, a sample of about 30 lbs. of fruit (0.3 bbl.) was taken from the truck Later, this sample would be run through a small version of the cleaning and drying process used in the plant. By comparing the before and after weight of this sample, it was possible to estimate the percentage of the truck's net weight made up of clean dry berries. At the same time, another sample was taken to determine the percentage of unusable berries (poor, smaller, and frosted berries) in the truck. The grower was credited for the estimated weight of the clean, dry, usable berries. (See Exhibit 2 for total 1995 deliveries of process berries.) At the time the truck was weighed, the truckload of berries was graded according to color. Using color pictures as a guide, the chief berry receiver classified the berries as Nos. 1. 2A, 2B. Or 3. from poorest color (No. 1) to best (No. 3). There was a premium of $1.50 per bbl paid for No. 3 berries, since color was considered to be a very important attribute of both juice products and whole sauce. Whenever there was any question about whether or not a truckload was No. 2B or No. 3 berries, the chief berry receiver usually chose No. 3. In 1995 the $1.50 premium was paid on about 450,000 bbls. of berries. When these berries were used, however, it was found that only about half of them were No. 3's. To improve this yield, Schaeffer was considering the installation of a light meter system for color grading. This system was projected to cost $40.000 and would require a full-time skilled operator at the same pay grade as the chief berry receiver. Temporary Holding After a truckload of process berries had been weighed, sampled, and color graded, the truck moved to one of the five Kiwanee dumpers. The truck was backed onto the dumper platform which then tilted until the contents of the truck dumped onto one of five rapidly moving belt conveyors. Each of the five conveyors took the berries to the second level of the plant and deposited them on other conveyors capable of running the berries into any one of 27 temporary holding bins. Bins numbered 1-24 held 250 bbls. of berries each. Bins 25, 26, and 27 held 400 bbls. each. All of the conveyors were controlled from a central control panel. It usually took from 7 to 8 minutes to back a truck onto a Kiwanee dumper, empty its contents. and leave the platform. At times some trucks had to wait several hours, however, before they could National Cranberry Cooperative, 19% 600-12 558-122 empty their contents. These waits occured when the holding bins became full and there was no place in the receiving plant to temporarily store berries before further operations. The holding bins emptied onto conveyors on the first level of the plant Once the bins were opened, the berries flowed onto the conveyors and started their way through the destoning (dry berries only), dechaffing, drying (water-harvested berries only), quality grading, and either bulk loading or bagging operations. Destoning, Dechaffing, and Drying Holding bins 25-27 were for wet (water-harvested) berries only. Holding bins 17-24 could be used for either wet or dry berries. Wet berries from these bins were taken directly to one of the three dechaffing units (destoning was unnecessary with water-harvested berries) which could process up to 1,500 bbls. per hour each. After dechaffing these wet berries were taken to one of the three drying units where they were dried at rates up to 200 bbls. per how per dryer. Holding bins 1-16 were for dry berries only. Berries from these bins were routed through one of three destoning units, each of which could process up to 1,500 bbls. of berries per hour, before going through a dechaffing unit. Frequently, both wet and dry berries were processed at the same time though the system. The wet berries would be processed through the part of the system that included the dryers, while the dry berries were processed through the area containing the destoning units. National Cranberry's current plant layout had two dechaffing units dedicated to wet berries, and one to dry berries. Superintendent Walliston had told O'Brien that with an increasing percentage of wet berries coming to the plant, it might make sense to convert some of holding bins 1-16 so they could be used for wet berries also. This would cost $10,000 per bin. Ol, perhaps, he had mentioned, a few new dryers might be needed. These would cost $60.000 each. He wondered what the benefits might be of adding more dryers and whether those benefits would warrant the cost. Quality Grading After destoning, dechaffing and drying, berries were transported to large take-away conveyors that moved berries from the first level of the receiving building to the third level of the adjoining separator building. Here these take away conveyors became "feed conveyors" as they were now feeding berries into the jumbo separators (see Figure B). The jumbo separators identified three classes of berries first quality berries, potential second-quality berries, and unacceptable berries. Figure B RP1 Separator Building FEED CONV CHUTE HOPPER JUMBO SEPXRATOR TAKE AWAY CONV WASTE CHUTE BAILEY MLL CHUTE HOPPER WASTE FLUYE TAKE AWAY CONV The separation process was a simple one that was based on the fact that good cranberries will bounce higher than poor cranberries (see Figure for a drawing of the separation process). Figure C Separator Operation Berries falling from separator hopper Bounce boards Gate To take-away conveyor To Bailey Mills Rejects go to waste flune The first-quality berries went directly onto one of three take-away conveyors on the second level and were transported to the shipping area. The unacceptable berries fell through waste chutes into water-filled waste flumes on the first level and were floated off to the disposal area. The potential second-quality berries fell into the Bailey mills on the second level of the building. The Bailey mills separated the stream of incoming berries into second-quality berries and unacceptable berries. The Bailey mills operated on the same principle as the jumbo separators. Over the years the percentage of second-quality berries had consistently been close to 12%. Each of the three separator lines could process up to 450 bbls. per hour, but the rate of processing declined as the percentage of bad fruit increased. It was estimated that the average effective capacity was probably close to 400 bbls. per hour for each line. Bulking and Bagging Conveyors carried berries from the separator building into the shipping building, feeding berries onto any one of the three main flexible conveyors in the shipping area. Each of the three conveyors in the shipping area could be moved to feed berries into bagging stations, bulk bin stations, or bulk 7 Exhibit 1 Log of Total Deliveries on September 23, 1995 Time Color Wet Dry Time Color Wet D Coler Wet Dry u u A 129 3 2 11 911 12. D W N 2 3 3 1 u 29 D 0 3 1 1 1 1 2 .45 46 Weight 3600 7230 .240 12700 2 18001 2240 13128 11241 1281 501 79561 4721 Time 969 454 257 959 - 22 95 969 975 977 940 1 3 2 n 0 0 es 645 64 650 691 ESS bet 60 EE -55 Weight 33940 9980 10020 12200 7520 4140 11720 6520 1480 12660 31640 11970 ZNAD 6020 12640 3940 6069 4160 1889 725 1960 3 3 5 4 29 0 1 0 3 2.b 10 906 FJ . $49 0 24641 1843 52760 1000 1005 D TER 671 67! E74 677 EZ 64 the 1290 4921 1010 1011 1012 1992 10 1943 1046 1447 1950 1051 1956 1951 1960 1073 511 D 701 703 ang #11 1 5500 Weight 1:54 1758 11040 1740 1:500 1000 1941 6760 1661 LOND 12140 +420 15200 11921 12120 25 75L. 7!AD 11220 4 60 11100 3100 1109 3500 91589 720 500 790 4740 2.70 ..60 1152 8360 101 2140 101 140 2660 13120 3:00 13420 TADO 7254 6:41 120 N40 6:50 9120 9190 960 7460 3100 10 1116 11160 1140 10140 119 17491 350 440 7451 13720 11 J40 81 823 A25 A! 14: n D D n 1 1266 5620 2941 #2 7777 7I 20401 12211 7420 3140 33740 786 1570 1150 11460 9300 4 SAD 11250 12720 84 SZNO 164 11100 2960 D W D W D 960 45 143 45 446 840 MSC 455 RAZ 874 STE 477 478 879 70 672 677 ERG 1042 1044 1025 1090 1095 1092 1095 1101 1111 1116 1126 1127 1129 1132 1114 1100 1140 1140 1140 1140 114 P4 CAD 8P7 395 197 900 2 D . wat TO 06 7640 3580 8440 4580 7560 4540 9040 3360 270 13500 11560 14140 20340 9600 13020 2620 0 D ch 909 601 44 #rg $75 ETD 916 922 974 2:7 942 945 947 7990 #900 1140 7160 1763 #70 760 16440 9160 15960 1200 10300 1100 1140 1140 1149 O N 0 Cranberries Delivered We Dry Copri Cabe 2 Cobr #3 Total pounds Total number of tracks 768.000 1,065,420 34,460 401,080 1.393,480 1,834,020 243 Note: All weights are an pounds. The time corded was titles er 1200 AM. For example, the recorded me of 411 was equivalent to 631 AM Exhibit 2 Deliveries of Process Berries 1995 Total Deliveries (scale weight in bbls.) Delivered Wet Day Color No. 1 Color No. 2 Color No.3 6% 0 72% 44 35 9/1-9/19 9/20 9/21 9/22 9/23 9/24 9/25 9/26 9/27 9/28 9/29 9/30 10/1 10/2 10/3 104 1015 10/0 10/7 10/8 10/9 10/10-12/10 Total barrels 44,176 16.014 17.024 16.550 18.340 18.879 18.257 17,905 16.281 13,343 18.717 18.063 18.018 15.195 15,816 16,536 17,304 14,793 13,862 11.788 14.913 238,413 610.185 54% 31 39 39 42 41 36 45 42 38 43 50 69 60 60 57 55 46 61 56 54 75 58 - JOOWINNOOOONO 21 14 10 18 15 11 9 11 18 12 21 28 22% 58 85 78 78 79 88 90 82 85 88 90 88 80 85 74 72 81 58 84 67 78 74 25 National Cranberry Cooperative, 1996 On February 14, 1996, Hugo Schaeffer, vice president of operations at the National Cranberry Cooperative (NCC), called his assistant, Mel O'Brien, into his office. Mel. I spent all day yesterday reviewing last fall's process fruit operations at receiving plant #1 [RP1] with Will Walliston, the superintendent, and talking with the co-op members (growers) in that area. It's obvious to me that we haven't solved our problems at that plant, yet. Even though we spent $200,000 last winter for a fifth Kiwanee dumper at RPI. our overtime costs were still out of control last fall, and the growers are still upset that their trucks and drivers had to spend so much time waiting to unload process fruit into the receiving plant. I can't blame them for being upset. They are the owners of this cooperative and they resent having to lease trucks and hire drivers to get the berries out of the field and then watch them stand idle, waiting to unload! Walliston thinks that the way to avoid these problems next fall is to increase our capacity by buying some new equipment I want you to go out there and take a hard look at the RP1 operation and find out what we need to do to improve operations before the 1996 crop comes in. We're going to have to move quickly if we are going to order new equipment, since the purchasing and installation lead times are in excess of six months. By the way, the growers in that region indicated that they plan on about the same size crop this year as last. But it looks like the percentage of water-harvested berries this year will increase to 70% of total process fruit from last year's 58%, which means that we'll have to change the way we schedule ou daily operations. NCC and the Cranberry Industry NCC was an organization formed and owned by growers of cranberries to process and market their berries. In recent years, 99% of all sales of cranberries were made by the various cooperatives active in the cranberry industry. NCC was one of the larger cooperatives and had operations in all the principal growing areas of North America: Massachusetts, New Jersey, Wisconsin, Washington. Oregon, British Columbia, and Nova Scotia Table A contains industry data for U.S. production and sales of cranberries. Production Utilization in barrels) Acreage Barrels Harvested Production Fresh Sales Average Price (all uses, per barrel) Crop Year per Acre Process Five-Year Average 1980-1984 1985-1989 1970-1974 1975-1979 1980-1984 1985-1989 1990-1994 Annual 1990 1991 1992 1993 1994 1995 26,022 25,434 26,205 24,842 21,448 20,778 20,988 23.7 24.9 31.3 39.8 51.2 62.6 73.7 615,000 643,300 822,580 983.680 1,096,180 1,300,120 1,548,120 466,844 380,985 381,320 439,170 427.520 468,340 327.980 148,256 253,335 438,080 532,070 543,860 755,750 1,169,360 22.12 31.00 34.30 23.42 21.54 24.00 38.24 20,640 20,760 21,220 21,135 21,185 21,445 89.6 77.0 66.2 69.4 86.1 1,436,800 1,588,600 1.404,300 1,487,800 1,823,100 2,038,600 389,800 328.000 278,300 301.900 342.100 367,000 1,033.200 1,249,800 1,034.000 1.111.200 1,417,900 1,418,600 31.00 34 32 3720 41.24 42.20 36.10 95.1 Source: Annual reports of Crop Reporting Board, Statistical Service. USDA. Note: Data gathered on five states -- Massachusetts, New Jersey, Oregon, Washington, and Wisconsin. Differences between production and utilization (fresh sales and process) represent economic abandonment. Beginning in 1964 the series represents equivalent returns at first receiving station, fresh and processing, combined. Years prior to 1964 represent season average prices received by growers for all methods of sale,fresh and processing combined. Preliminary figures for 1995 Some significant trends are observable in Table A. Probably the most important trend was the increasing surplus of cranberries produced over those utilized. This suplus was serious enough by 1993 for the growers to resort to the Agriculture Marketing Agreement Act of 1937. Under this act, growers can regulate and control the size of an agricultural crop if the federal government and more than two-thirds of the growers agree to a plan for crop restriction. In 1993, 87% of the growers agreed (making it binding on the others also) that no new acreage was to be developed over the next six years and that each grower would have a maximum allotment at the end of six years equal to the average of the grower's best two years from 1993 through 1998. In 1995 the growers resorted to the Agriculture Marketing Agreement Act once again. Under the Cranberry Marketing Order of 1995, the growers and the government agreed that 10% of the 1995 crop should be set aside. The set aside berries (berries that are either destroyed or used in a way that will not influence the market price) amounted to more than 200,000 barrels (bbls). (A barrel of cranberries weighs 100 lbs.) Handlers physically set aside 10% of the berries before harvesting, under the supervision of a committee of growers and representatives from the Department of Agriculture. Another important trend was the increasing mechanization of cranberry harvesting Water harvesting in particular, was developing rapidly in the vicinity of receiving plant No. 1. Under the traditional dry harvesting, berries were hand-picked from the bushes. In water harvesting, the bogs were flooded, the berries were mechanically shaken from the bushes, and the berries then were collected easily since they floated to the surface of the water. Water harvesting could result in yields up to 20% greater than those obtained via dry harvesting, but it caused some damage and it shortened the time that harvested fruit could be held prior to either its use or freezing for long-term storage. Water harvesting had developed at a remarkable rate in some areas. Receiving plant No. 1 received 25.000 bbls. of water-harvested fruit in 1993, 125,000 bbls. in 1994, and 350,000 bbls. in 1995. Receiving Plant No. 1 (RPI) RPI received both "fresh fruit and process" fruit during a season that usually started early in September and was effectively finished by early December (see Figure A). The fresh fruit operation (preparing cranberries for sale as whole fresh fruit) was completely separate from the process fruit operation (that prepares cranberries for juice, canning, freezing and other process fruit products) and took the fruit from receiving through packaging. This case is concerned only with the process fruit operation Figure A Daily Delivery of Both Fresh and Process Berries to RP1 Bbls. Total Barrets 29,000 483,701 533,426 678,18: 1002 1993 10,000 95 9/15 9/25 10/5 10/15 1114 The handling of process fruit at RPI was highly mechanized. The process could be classified into several operations receiving and testing, dumping temporary holding destoning? deshaffing drying separation and bulking and bagging. The objective of the total process was to gather bulk berries and prepare them for storage and processing into frozen fresh berries, sauce, and juice. Process Fruit Receiving Bulk trucks carrying process berries arrived at RPI randomly throughout the day as shown in Exhibit 1. The average truck delivery was 75 bbls. When the trucks arrived at RP1 they were weighed, and the gross weight and the tare (empty) weight were recorded. Prior to unloading, a sample of about 30 lbs. of fruit (0.3 bbl.) was taken from the truck Later, this sample would be run through a small version of the cleaning and drying process used in the plant. By comparing the before and after weight of this sample, it was possible to estimate the percentage of the truck's net weight made up of clean dry berries. At the same time, another sample was taken to determine the percentage of unusable berries (poor, smaller, and frosted berries) in the truck. The grower was credited for the estimated weight of the clean, dry, usable berries. (See Exhibit 2 for total 1995 deliveries of process berries.) At the time the truck was weighed, the truckload of berries was graded according to color. Using color pictures as a guide, the chief berry receiver classified the berries as Nos. 1. 2A, 2B. Or 3. from poorest color (No. 1) to best (No. 3). There was a premium of $1.50 per bbl paid for No. 3 berries, since color was considered to be a very important attribute of both juice products and whole sauce. Whenever there was any question about whether or not a truckload was No. 2B or No. 3 berries, the chief berry receiver usually chose No. 3. In 1995 the $1.50 premium was paid on about 450,000 bbls. of berries. When these berries were used, however, it was found that only about half of them were No. 3's. To improve this yield, Schaeffer was considering the installation of a light meter system for color grading. This system was projected to cost $40.000 and would require a full-time skilled operator at the same pay grade as the chief berry receiver. Temporary Holding After a truckload of process berries had been weighed, sampled, and color graded, the truck moved to one of the five Kiwanee dumpers. The truck was backed onto the dumper platform which then tilted until the contents of the truck dumped onto one of five rapidly moving belt conveyors. Each of the five conveyors took the berries to the second level of the plant and deposited them on other conveyors capable of running the berries into any one of 27 temporary holding bins. Bins numbered 1-24 held 250 bbls. of berries each. Bins 25, 26, and 27 held 400 bbls. each. All of the conveyors were controlled from a central control panel. It usually took from 7 to 8 minutes to back a truck onto a Kiwanee dumper, empty its contents. and leave the platform. At times some trucks had to wait several hours, however, before they could National Cranberry Cooperative, 19% 600-12 558-122 empty their contents. These waits occured when the holding bins became full and there was no place in the receiving plant to temporarily store berries before further operations. The holding bins emptied onto conveyors on the first level of the plant Once the bins were opened, the berries flowed onto the conveyors and started their way through the destoning (dry berries only), dechaffing, drying (water-harvested berries only), quality grading, and either bulk loading or bagging operations. Destoning, Dechaffing, and Drying Holding bins 25-27 were for wet (water-harvested) berries only. Holding bins 17-24 could be used for either wet or dry berries. Wet berries from these bins were taken directly to one of the three dechaffing units (destoning was unnecessary with water-harvested berries) which could process up to 1,500 bbls. per hour each. After dechaffing these wet berries were taken to one of the three drying units where they were dried at rates up to 200 bbls. per how per dryer. Holding bins 1-16 were for dry berries only. Berries from these bins were routed through one of three destoning units, each of which could process up to 1,500 bbls. of berries per hour, before going through a dechaffing unit. Frequently, both wet and dry berries were processed at the same time though the system. The wet berries would be processed through the part of the system that included the dryers, while the dry berries were processed through the area containing the destoning units. National Cranberry's current plant layout had two dechaffing units dedicated to wet berries, and one to dry berries. Superintendent Walliston had told O'Brien that with an increasing percentage of wet berries coming to the plant, it might make sense to convert some of holding bins 1-16 so they could be used for wet berries also. This would cost $10,000 per bin. Ol, perhaps, he had mentioned, a few new dryers might be needed. These would cost $60.000 each. He wondered what the benefits might be of adding more dryers and whether those benefits would warrant the cost. Quality Grading After destoning, dechaffing and drying, berries were transported to large take-away conveyors that moved berries from the first level of the receiving building to the third level of the adjoining separator building. Here these take away conveyors became "feed conveyors" as they were now feeding berries into the jumbo separators (see Figure B). The jumbo separators identified three classes of berries first quality berries, potential second-quality berries, and unacceptable berries. Figure B RP1 Separator Building FEED CONV CHUTE HOPPER JUMBO SEPXRATOR TAKE AWAY CONV WASTE CHUTE BAILEY MLL CHUTE HOPPER WASTE FLUYE TAKE AWAY CONV The separation process was a simple one that was based on the fact that good cranberries will bounce higher than poor cranberries (see Figure for a drawing of the separation process). Figure C Separator Operation Berries falling from separator hopper Bounce boards Gate To take-away conveyor To Bailey Mills Rejects go to waste flune The first-quality berries went directly onto one of three take-away conveyors on the second level and were transported to the shipping area. The unacceptable berries fell through waste chutes into water-filled waste flumes on the first level and were floated off to the disposal area. The potential second-quality berries fell into the Bailey mills on the second level of the building. The Bailey mills separated the stream of incoming berries into second-quality berries and unacceptable berries. The Bailey mills operated on the same principle as the jumbo separators. Over the years the percentage of second-quality berries had consistently been close to 12%. Each of the three separator lines could process up to 450 bbls. per hour, but the rate of processing declined as the percentage of bad fruit increased. It was estimated that the average effective capacity was probably close to 400 bbls. per hour for each line. Bulking and Bagging Conveyors carried berries from the separator building into the shipping building, feeding berries onto any one of the three main flexible conveyors in the shipping area. Each of the three conveyors in the shipping area could be moved to feed berries into bagging stations, bulk bin stations, or bulk 7 Exhibit 1 Log of Total Deliveries on September 23, 1995 Time Color Wet Dry Time Color Wet D Coler Wet Dry u u A 129 3 2 11 911 12. D W N 2 3 3 1 u 29 D 0 3 1 1 1 1 2 .45 46 Weight 3600 7230 .240 12700 2 18001 2240 13128 11241 1281 501 79561 4721 Time 969 454 257 959 - 22 95 969 975 977 940 1 3 2 n 0 0 es 645 64 650 691 ESS bet 60 EE -55 Weight 33940 9980 10020 12200 7520 4140 11720 6520 1480 12660 31640 11970 ZNAD 6020 12640 3940 6069 4160 1889 725 1960 3 3 5 4 29 0 1 0 3 2.b 10 906 FJ . $49 0 24641 1843 52760 1000 1005 D TER 671 67! E74 677 EZ 64 the 1290 4921 1010 1011 1012 1992 10 1943 1046 1447 1950 1051 1956 1951 1960 1073 511 D 701 703 ang #11 1 5500 Weight 1:54 1758 11040 1740 1:500 1000 1941 6760 1661 LOND 12140 +420 15200 11921 12120 25 75L. 7!AD 11220 4 60 11100 3100 1109 3500 91589 720 500 790 4740 2.70 ..60 1152 8360 101 2140 101 140 2660 13120 3:00 13420 TADO 7254 6:41 120 N40 6:50 9120 9190 960 7460 3100 10 1116 11160 1140 10140 119 17491 350 440 7451 13720 11 J40 81 823 A25 A! 14: n D D n 1 1266 5620 2941 #2 7777 7I 20401 12211 7420 3140 33740 786 1570 1150 11460 9300 4 SAD 11250 12720 84 SZNO 164 11100 2960 D W D W D 960 45 143 45 446 840 MSC 455 RAZ 874 STE 477 478 879 70 672 677 ERG 1042 1044 1025 1090 1095 1092 1095 1101 1111 1116 1126 1127 1129 1132 1114 1100 1140 1140 1140 1140 114 P4 CAD 8P7 395 197 900 2 D . wat TO 06 7640 3580 8440 4580 7560 4540 9040 3360 270 13500 11560 14140 20340 9600 13020 2620 0 D ch 909 601 44 #rg $75 ETD 916 922 974 2:7 942 945 947 7990 #900 1140 7160 1763 #70 760 16440 9160 15960 1200 10300 1100 1140 1140 1149 O N 0 Cranberries Delivered We Dry Copri Cabe 2 Cobr #3 Total pounds Total number of tracks 768.000 1,065,420 34,460 401,080 1.393,480 1,834,020 243 Note: All weights are an pounds. The time corded was titles er 1200 AM. For example, the recorded me of 411 was equivalent to 631 AM Exhibit 2 Deliveries of Process Berries 1995 Total Deliveries (scale weight in bbls.) Delivered Wet Day Color No. 1 Color No. 2 Color No.3 6% 0 72% 44 35 9/1-9/19 9/20 9/21 9/22 9/23 9/24 9/25 9/26 9/27 9/28 9/29 9/30 10/1 10/2 10/3 104 1015 10/0 10/7 10/8 10/9 10/10-12/10 Total barrels 44,176 16.014 17.024 16.550 18.340 18.879 18.257 17,905 16.281 13,343 18.717 18.063 18.018 15.195 15,816 16,536 17,304 14,793 13,862 11.788 14.913 238,413 610.185 54% 31 39 39 42 41 36 45 42 38 43 50 69 60 60 57 55 46 61 56 54 75 58 - JOOWINNOOOONO 21 14 10 18 15 11 9 11 18 12 21 28 22% 58 85 78 78 79 88 90 82 85 88 90 88 80 85 74 72 81 58 84 67 78 74 25Step by Step Solution
There are 3 Steps involved in it
Step: 1

Get Instant Access to Expert-Tailored Solutions
See step-by-step solutions with expert insights and AI powered tools for academic success
Step: 2

Step: 3
Ace Your Homework with AI
Get the answers you need in no time with our AI-driven, step-by-step assistance
Get Started
Data Access Patterns Database Interactions In Object Oriented Applications
Authors: Clifton Nock
1st Edition
0321555627, 978-0321555625