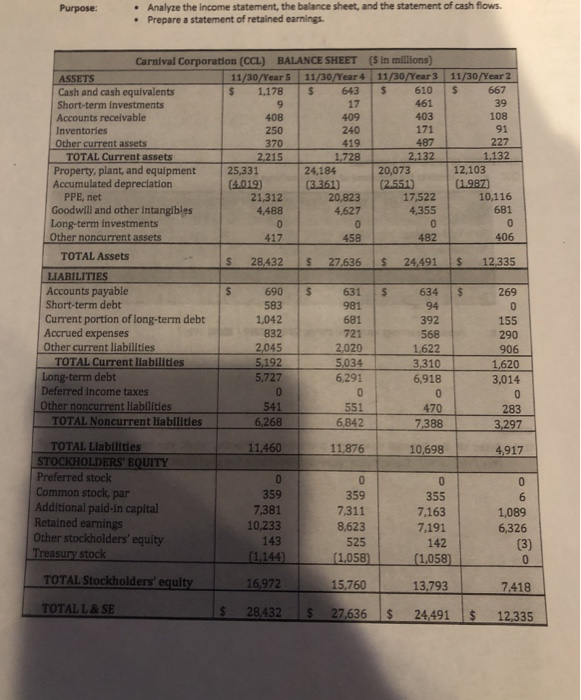
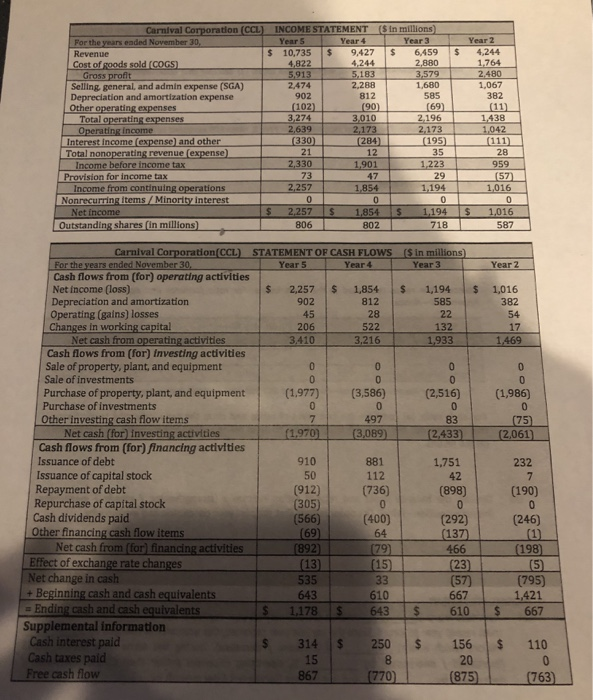
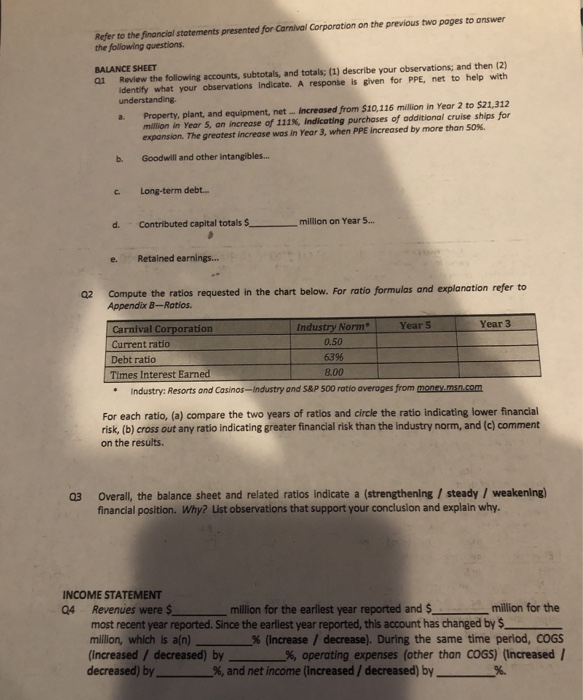
. Analyze the income statement, the balance sheet, and the statement of cash flows . Prepare a statement of retained earnings Carnival Corporation (CCL) BALANCE SHEET ($ in millions) Cash and cash equivalents Short-term investments Accounts receivable Inventories Other current assets 11/30/Year 5 11/30/Year 4 11/30/Year 3 11/30/Year 2 1,178S643 610$ 667 39 108 91 227 1,132 461 403 408 250 419487 TOTAL Current assets 2,215 1.728 Property, plant, and equipment 25,331 24,184 20,073 12,103 Accumulated depreciation 10,116 681 PPE, net Goodwill and other Intangibles Long-term investments Other noncurrent assets 21,312 4,488 17,522 4,627 458 482 406 TOTAL Assets LIABILITIES Accounts payable Short-term debt Current portion of long-term debt Accrued expenses Other current liabilities S 690 631$ 634 269 583 1,042 832 392 568 1,622 3,310 6,918 155 290 906 721 TOTAL Current liabilities Long-term debt Deferred income taxes Other noncurrent liabilities 5,727 6,291 3,014 470 283 3,297 TOTAL Noncurrent llabilities 6,842 7 TOTAL Liabilities STOCKHOLDERS' EQUITY Preferred stock Common stock, par Additional paid-in capital Retained earnings Other stockholders' equity Treasury stock 11,460 11,876 10,698 4,917 359 7,381 10,233 143 144 359 7,311 8,623 525 355 7,163 7,191 142 1,089 6,326 TOTAL Stockholders' equity 16,972 15,760 13,793 7,418 TOTAL L&SE |$ 28,432 IS 6 |$ 24,491 |$ 12,335 INCOME STATEMENT Year 4 Carnival tion (CCL) ($ in millions) Year 3 Year 2 $ 10,735$9427 6,4594,244 1.764 480 1,067 382 Cost of goods sold (COGS) 4,244 2,880 2474 902 102 3,274 2,288 Selling, general, and admin expense (SGA) Depreclation and amortization expense Other operating expenses 1,680 585 69) Total operating expenses 330 195 Interest income (expense) and other Total nonoperatingrevenuelexpense). 284 Income from continuing operations Outstanding shares (in millions) 18 587 Carnival Corporation( CCL) STATEMENT OF CASH FLOWS Year5 Year4 ($ in m- Year3 ) Year 2 Cash flows from (for) operating activities $ 2,257 1,854$1,194 1,016 382 Net income (loss) Depreciation and amortization 812 522 3,216 902 45 206 410 585 Operating (gains) losses Changes in working capital 132 1469 Cash flows from (for) Investing activities Sale of property, plant, and equipment Sale of investments Purchase of property, plant, and equipment(1.977) Purchase of investments Other investing cash flow items (3,586) (2,516) (1,986) 497 3089 (1.970160s 881 112 Cash flows from (for) financing activities Issuance of debt 910 1,751 42 (898) Issuance of capital stock Repayment of debt Repurchase of capital stock Cash dividends paid (912) (305) (566) (736) (190) (292)(246) 466(198 (400) 64 et cash from (for) financing activities Effect of exchange rate changes Net change in cash + Beginning cash and cash equivalents 535 643 (795) (57) 667 1,421 643 $ 610 667 h and cash Supplemental information Cash interest paid Cash taxes paid 314 $ 250156 110 15 867 875 Refer to the financial statements presented for Carnival Corporation on the previous two pages to answer the following questions ai Review the following accounts, subtotals, and totals; (1) describe your observations; and then (2) identify what your observations Indicate. A response is given for PPE, net to help with BALANCE SHEET understanding a. Property, plant, and equipment, net... Increased from $10,116 million in Year 2 to $21,312 million in Year 5, an increase of 111%, indicating purchases of additional cruise ships for expansion. The greatest increase was in Year 3, when PPE increased by more than 50%. b. Goodwill and other intangible.s.. c Long-term debt. d. Contributed capital totals millon on Year . e. Retained earnings... 02 Compute the ratios requested in the chart below. For ratio formulas and explanation refer to Appendix B-Ratios Year 3 Industry Norm Year S Carnival Corporation Current ratio Debt ratio Times Interest Earned 0.50 6396 8.00 Industry: Resorts and Casinos-Industry and S&P 500 ratio averages from money.msn.com For each ratio, (a) compare the two years of ratios and circle the ratio indicating lower financial risk, (b) cross out any ratio indicating greater financial risk than the industry norm, and (c) comment on the results. Overall, the balance sheet and related ratios indicate a (strengthening/steady/ weakening) financial position. Why? List observations that support your conclusion and explain why. 03 INCOME STATEMENT Q4 Revenues were million for the earliest year reported and $ million for the most recent year reported. Since the earliest year reported, this account has changed by $ million, which is a(n) % (increase / decrease). During the same time period, COGS (increased / decreased) by 96, operating expenses (other than COGS) (increased 1 decreased) by%, and net income (increased / decreased) by%