Answered step by step
Verified Expert Solution
Question
1 Approved Answer
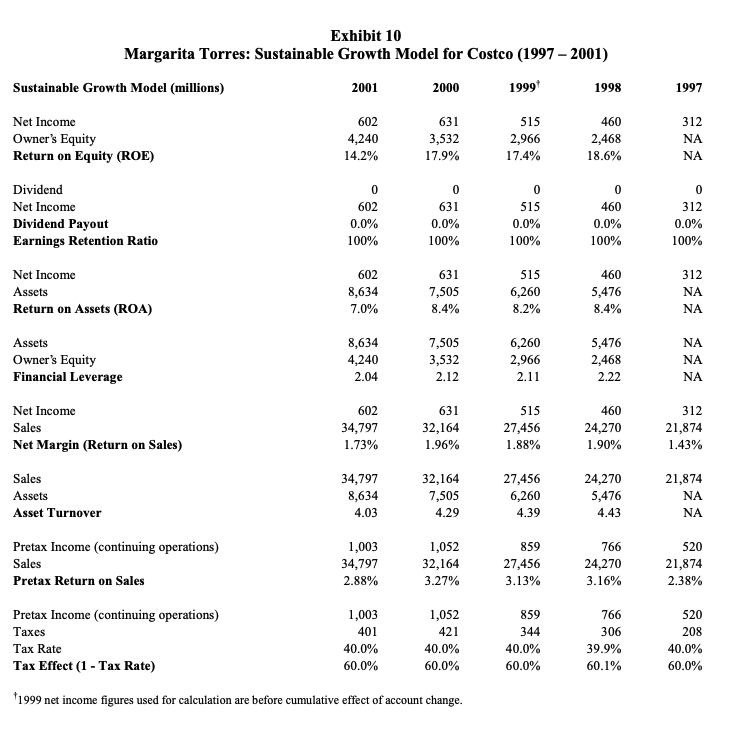
Analyze the key rations and business implications. Exhibit 10 Margarita Torres: Sustainable Growth Model for Costco (1997 - 2001) Sustainable Growth Model (millions) 2001 2000

Analyze the key rations and business implications.
Exhibit 10 Margarita Torres: Sustainable Growth Model for Costco (1997 - 2001) Sustainable Growth Model (millions) 2001 2000 1999 1998 1997 602 Net Income Owner's Equity Return on Equity (ROE) 4,240 14.2% 631 3,532 17.9% 515 2,966 17.4% 460 2,468 18.6% 312 NA NA Dividend Net Income Dividend Payout Earnings Retention Ratio 0 602 0.0% 100% 0 631 0.0% 100% 0 515 0.0% 100% 0 460 0.0% 100% 0 312 0.0% 100% Net Income Assets Return on Assets (ROA) 602 8,634 7.0% 631 7,505 8.4% 515 6,260 8.2% 460 5,476 8.4% 312 NA NA Assets Owner's Equity Financial Leverage 8,634 4,240 2.04 7,505 3,532 2.12 6,260 2,966 2.11 5,476 2,468 2.22 NA NA NA Net Income Sales Net Margin (Return on Sales) 602 34,797 1.73% 631 32,164 1.96% 515 27,456 1.88% 460 24,270 1.90% 312 21,874 1.43% Sales Assets Asset Turnover 34,797 8,634 4.03 32,164 7,505 4.29 27,456 6,260 4.39 24,270 5,476 4.43 21,874 NA NA Pretax Income (continuing operations) Sales Pretax Return on Sales 1,003 34,797 2.88% 1,052 32,164 3.27% 859 27,456 3.13% 766 24,270 3.16% 520 21,874 2.38% Pretax Income (continuing operations) Taxes Tax Rate Tax Effect (1 - Tax Rate) 1,003 401 40.0% 60.0% 1,052 421 40.0% 60.0% 859 344 40.0% 60.0% 766 306 39.9% 60.1% 520 208 40.0% 60.0% *1999 net income figures used for calculation are before cumulative effect of account changeStep by Step Solution
There are 3 Steps involved in it
Step: 1

Get Instant Access to Expert-Tailored Solutions
See step-by-step solutions with expert insights and AI powered tools for academic success
Step: 2

Step: 3

Ace Your Homework with AI
Get the answers you need in no time with our AI-driven, step-by-step assistance
Get Started


