Answered step by step
Verified Expert Solution
Question
1 Approved Answer
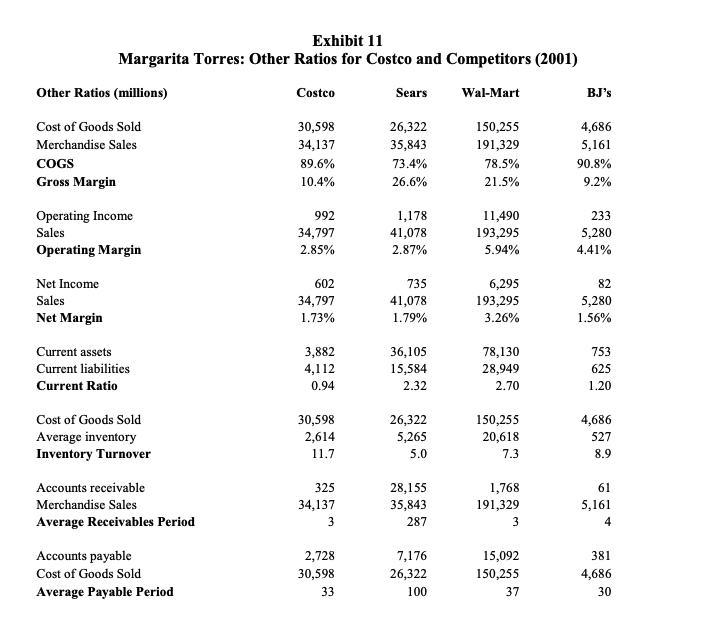
Analyze the key rations and business implications. Exhibit 11 Margarita Torres: Other Ratios for Costco and Competitors (2001) Other Ratios (millions) Costco Sears Wal-Mart BJ's

Analyze the key rations and business implications.
Exhibit 11 Margarita Torres: Other Ratios for Costco and Competitors (2001) Other Ratios (millions) Costco Sears Wal-Mart BJ's Cost of Goods Sold Merchandise Sales COGS Gross Margin 30,598 34,137 89.6% 10.4% 26,322 35,843 73.4% 26.6% 150,255 191,329 78.5% 21.5% 4,686 5,161 90.8% 9.2% Operating Income Sales Operating Margin 992 34,797 2.85% 1,178 41,078 2.87% 11,490 193,295 5.94% 233 5,280 4.41% Net Income Sales Net Margin 602 34,797 1.73% 735 41,078 1.79% 6,295 193,295 3.26% 82 5,280 1.56% Current assets Current liabilities Current Ratio 3,882 4,112 0.94 36,105 15,584 2.32 78,130 28,949 2.70 753 625 1.20 Cost of Goods Sold Average inventory Inventory Turnover 30,598 2,614 11.7 26,322 5,265 5.0 150,255 20,618 7.3 4,686 527 8.9 Accounts receivable Merchandise Sales Average Receivables Period 325 34,137 3 28,155 35,843 287 1,768 191,329 61 5,161 4 Accounts payable Cost of Goods Sold Average Payable Period 2,728 30,598 33 7,176 26,322 100 15,092 150,255 37 381 4,686 30Step by Step Solution
There are 3 Steps involved in it
Step: 1

Get Instant Access to Expert-Tailored Solutions
See step-by-step solutions with expert insights and AI powered tools for academic success
Step: 2

Step: 3

Ace Your Homework with AI
Get the answers you need in no time with our AI-driven, step-by-step assistance
Get Started


