

Answered step by step
Verified Expert Solution
Question
1 Approved Answer
Analyze the tables below and explain the possible reasons for such data. Year 2016 2017 2018 2019 Year 2016 2017 2018 2019 Phili GDP $3

Analyze the tables below and explain the possible reasons for such data.
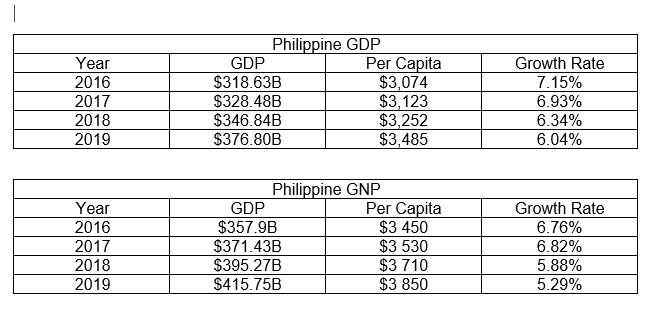
Year 2016 2017 2018 2019 Year 2016 2017 2018 2019 Phili GDP $3 863B $328 48B S346_84B S376_80B Phili GDP $357.98 $37143B S395_27B $41575B ine GDP Per Ca ita $3 074 $3 123 $3 252 $3 485 ine GNP Per Ca ita $3 450 $3 530 $3 710 $3 850 Growth Rate 7.150/0 6.930/0 6.340/0 6.040/0 Growth Rate 6.760/0 6.820/0 5.880/0 5 290/0
Step by Step Solution
There are 3 Steps involved in it
Step: 1

Get Instant Access to Expert-Tailored Solutions
See step-by-step solutions with expert insights and AI powered tools for academic success
Step: 2

Step: 3
Ace Your Homework with AI
Get the answers you need in no time with our AI-driven, step-by-step assistance
Get Started
Global Business Today
Authors: Charles W. L. Hill Dr, G. Tomas M. Hult
10th edition
1259686698, 978-1259686696