Analyze their financial statements (Statement of Cash Flows, Income Statement, and Balance Sheet), and provide a detailed summary of their financial performance. You are expected to include your own tables/illustrations as part of this summary to reinforce your position. Your analysis should include a wide range of financial and performance indicators along with your interpretations of these measurements.


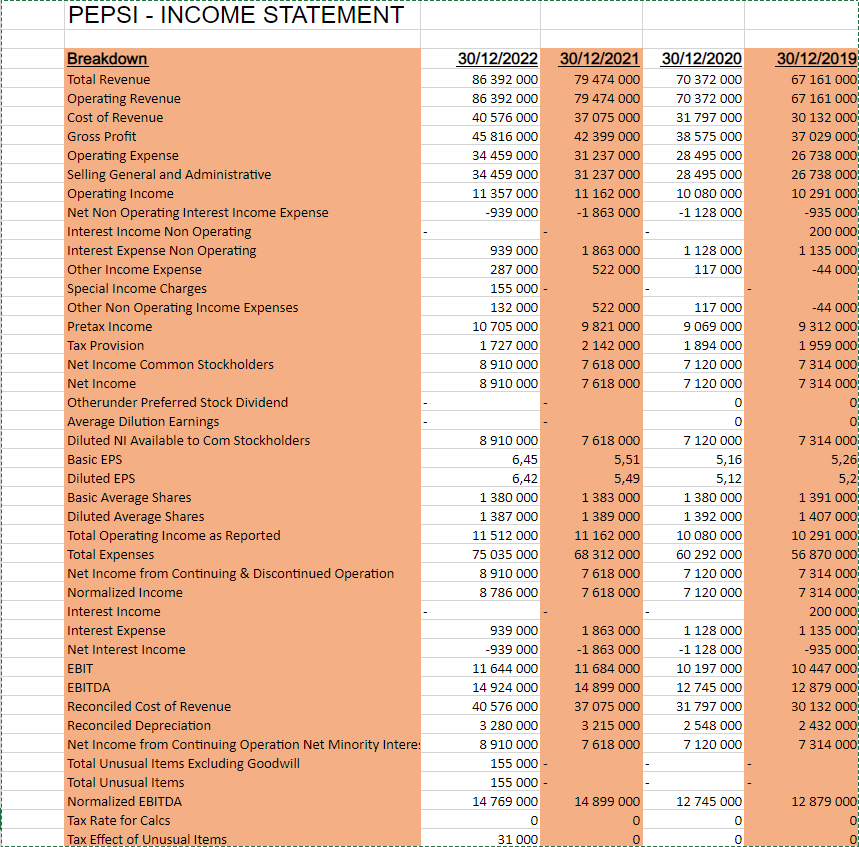
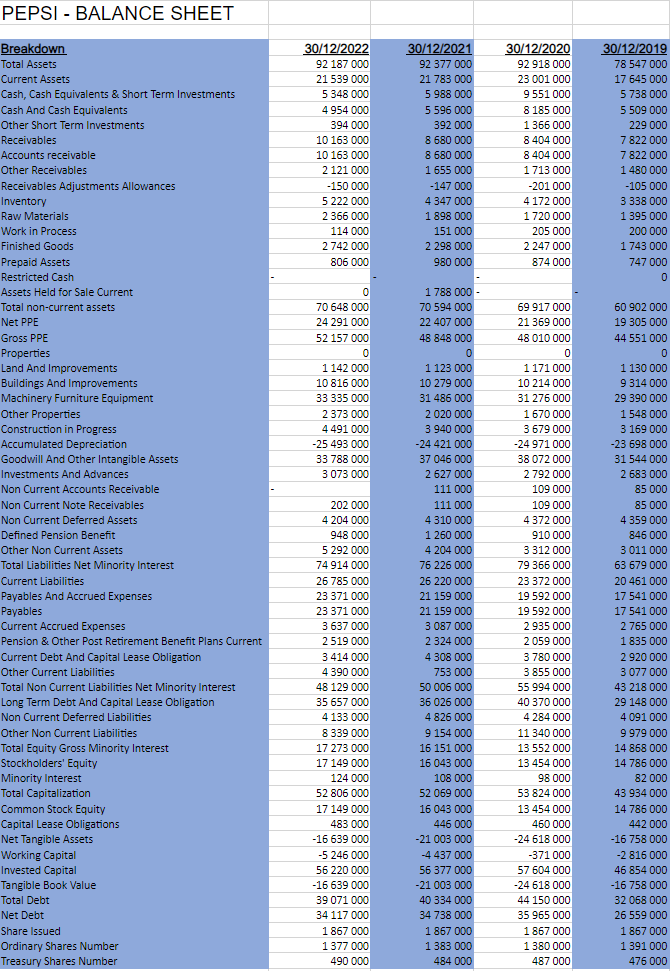
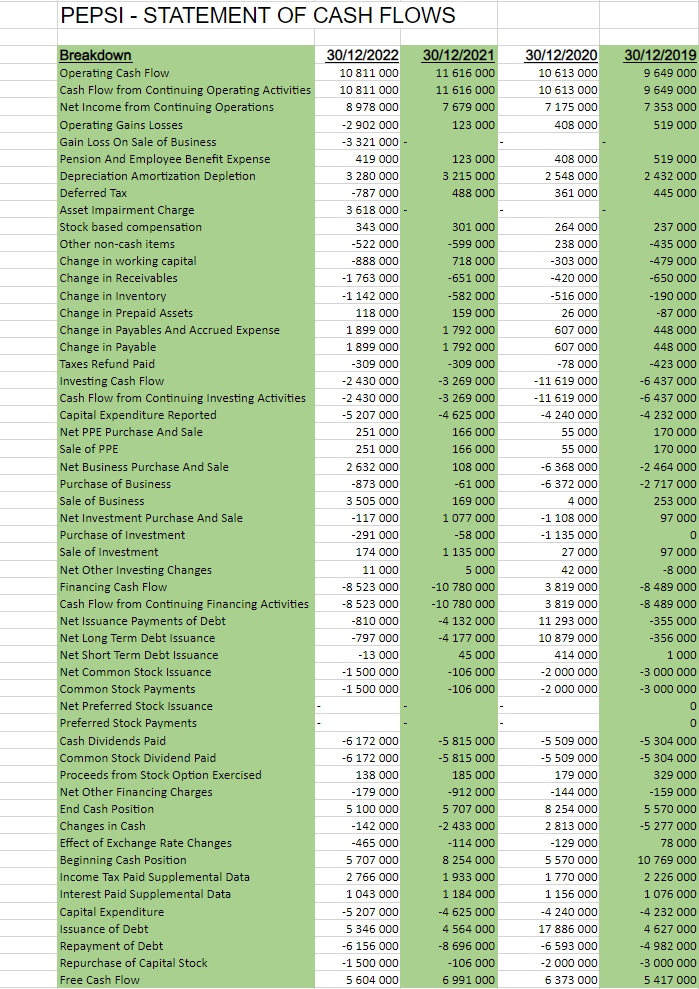
PEPSI - INCOME STATEMENT Breakdown Total Revenue Operating Revenue Cost of Revenue Gross Profit Operating Expense Selling General and Administrative Operating Income Net Non Operating Interest Income Expense Interest Income Non Operating Interest Expense Non Operating Other Income Expense Special Income Charges Other Non Operating Income Expenses Pretax Income Tax Provision Net Income Common Stockholders Net Income Otherunder Preferred Stock Dividend Average Dilution Earnings Diluted NI Available to Com Stockholders Basic EPS Diluted EPS Basic Average Shares Diluted Average Shares Total Operating Income as Reported Total Expenses Net Income from Continuing \& Discontinued Operation Normalized Income Interest Income Interest Expense Net Interest Income EBIT EBITDA Reconciled Cost of Revenue Reconciled Depreciation Net Income from Continuing Operation Net Minority Intere: Total Unusual Items Excluding Goodwill Total Unusual Items Normalized EBITDA Tax Rate for Calcs Tax Effect of Unusual Items \begin{tabular}{r} 30/12/2022 \\ \hline 86392000 \\ 86392000 \\ 40576000 \\ 45816000 \\ 34459000 \\ 34459000 \\ 11357000 \\ -939000 \end{tabular} 30/12/2021 79474000 79474000 37075000 42399000 31237000 31237000 11162000 1863000 939000 287000 155000 132000 10705000 1727000 8910000 8910000 1863000 1128000 522000 117000 522000 117000 9821000 9069000 2142000 1894000 7618000 7120000 7618000 7120000 - 0 0 - \begin{tabular}{|r|r|} & 0 \\ \hline 7618000 & 7120000 \\ \hline 5,51 & 5,16 \\ 5,49 & 5,12 \\ \hline 1383000 & 1380000 \\ 1389000 & 1392000 \\ \hline 11162000 & 10080000 \\ \hline 68312000 & 60292000 \\ \hline 7618000 & 7120000 \\ \hline 7618000 & 7120000 \\ \hline \end{tabular} 8910000 6,45 6,42 1380000 1387000 11512000 75035000 8910000 8786000 939000 \begin{tabular}{|r|r|} \hline 1863000 & 1128000 \\ \hline-1863000 & -1128000 \\ \hline 11684000 & 10197000 \\ \hline 14899000 & 12745000 \\ \hline 37075000 & 31797000 \\ \hline 3215000 & 2548000 \\ \hline 7618000 & 7120000 \\ \hline \end{tabular} 939000 11644000 14924000 40576000 3280000 8910000 155000 155000 - 14769000 14899000 12745000 0 0 12879000 31000 0 0 \begin{tabular}{|c|c|c|c|c|} \hline \multicolumn{5}{|l|}{ PEPSI - BALANCE SHEET } \\ \hline Breakdown & 30/12/2022 & 30/12/2021 & 30/12/2020 & 30/12/2019 \\ \hline Total Assets & 92187000 & 92377000 & 92918000 & 78547000 \\ \hline Current Assets & 21539000 & 21783000 & 23001000 & 17645000 \\ \hline Cash, Cash Equivalents \& Short Term Investments & 5348000 & 5988000 & 9551000 & 5738000 \\ \hline Cash And Cash Equivalents & 4954000 & 5596000 & 8185000 & 5509000 \\ \hline Other Short Term Investments & 394000 & 392000 & 1366000 & 229000 \\ \hline Receivables & 10163000 & 8680000 & 8404000 & 7822000 \\ \hline Accounts receivable & 10163000 & 8680000 & 8404000 & 7822000 \\ \hline Other Receivables & 2121000 & 1655000 & 1713000 & 1480000 \\ \hline Receivables Adjustments Allowances & -150000 & -147000 & -201000 & -105000 \\ \hline Inventory & 5222000 & 4347000 & 4172000 & 3338000 \\ \hline Raw Materials & 2366000 & 1898000 & 1720000 & 1395000 \\ \hline Work in Process & 114000 & 151000 & 205000 & 200000 \\ \hline Finished Goods & 2742000 & 2298000 & 2247000 & 1743000 \\ \hline Prepaid Assets & 806000 & 980000 & 874000 & 747000 \\ \hline Restricted Cash & & & & \\ \hline Assets Held for Sale Current & 0 & 1788000 & & \\ \hline Total non-current assets & 70648000 & 70594000 & 69917000 & 60902000 \\ \hline Net PPE & 24291000 & 22407000 & 21369000 & 19305000 \\ \hline Gross PPE & 52157000 & 48848000 & 48010000 & 44551000 \\ \hline Properties & 0 & 0 & 0 & \\ \hline Land And Improvements & 1142000 & 1123000 & 1171000 & 1130000 \\ \hline Buildings And Improvements & 10816000 & 10279000 & 10214000 & 9314000 \\ \hline Machinery Furniture Equipment & 33335000 & 31486000 & 31276000 & 29390000 \\ \hline Other Properties & 2373000 & 2020000 & 1670000 & 1548000 \\ \hline Construction in Progress & 4491000 & 3940000 & 3679000 & 3169000 \\ \hline Accumulated Depreciation & -25493000 & -24421000 & -24971000 & -23698000 \\ \hline Goodwill And Other Intangible Assets & 33788000 & 37046000 & 38072000 & 31544000 \\ \hline Investments And Advances & 3073000 & 2627000 & 2792000 & 2683000 \\ \hline Non Current Accounts Receivable & & 111000 & 109000 & 85000 \\ \hline Non Current Note Receivables & 202000 & 111000 & 109000 & 85000 \\ \hline Non Current Deferred Assets & 4204000 & 4310000 & 4372000 & 4359000 \\ \hline Defined Pension Benefit & 948000 & 1260000 & 910000 & 846000 \\ \hline Other Non Current Assets & 5292000 & 4204000 & 3312000 & 3011000 \\ \hline Total Liabilities Net Minority Interest & 74914000 & 76226000 & 79366000 & 63679000 \\ \hline Current Liabilities & 26785000 & 26220000 & 23372000 & 20461000 \\ \hline Payables And Accrued Expenses & 23371000 & 21159000 & 19592000 & 17541000 \\ \hline Payables & 23371000 & 21159000 & 19592000 & 17541000 \\ \hline Current Accrued Expenses & 3637000 & 3087000 & 2935000 & 2765000 \\ \hline Pension \& Other Post Retirement Benefit Plans Current & 2519000 & 2324000 & 2059000 & 1835000 \\ \hline Current Debt And Capital Lease Obligation & 3414000 & 4308000 & 3780000 & 2920000 \\ \hline Other Current Liabilities & 4390000 & 753000 & 3855000 & 3077000 \\ \hline Total Non Current Liabilities Net Minority Interest & 48129000 & 50006000 & 55994000 & 43218000 \\ \hline Long Term Debt And Capital Lease Obligation & 35657000 & 36026000 & 40370000 & 29148000 \\ \hline Non Current Deferred Liabilities & 4133000 & 4826000 & 4284000 & 4091000 \\ \hline Other Non Current Liabilities & 8339000 & 9154000 & 11340000 & 9979000 \\ \hline Total Equity Gross Minority Interest & 17273000 & 16151000 & 13552000 & 14868000 \\ \hline Stockholders' Equity & 17149000 & 16043000 & 13454000 & 14786000 \\ \hline Minority Interest & 124000 & 108000 & 98000 & 82000 \\ \hline Total Capitalization & 52806000 & 52069000 & 53824000 & 43934000 \\ \hline Common Stock Equity & 17149000 & 16043000 & 13454000 & 14786000 \\ \hline Capital Lease Obligations & 483000 & 446000 & 460000 & 442000 \\ \hline Net Tangible Assets & -16639000 & -21003000 & -24618000 & -16758000 \\ \hline Working Capital & -5246000 & -4437000 & -371000 & -2816000 \\ \hline Invested Capital & 56220000 & 56377000 & 57604000 & 46854000 \\ \hline Tangible Book Value & -16639000 & -21003000 & -24618000 & -16758000 \\ \hline Total Debt & 39071000 & 40334000 & 44150000 & 32068000 \\ \hline Net Debt & 34117000 & 34738000 & 35965000 & 26559000 \\ \hline Share Issued & 1867000 & 1867000 & 1867000 & 1867000 \\ \hline Ordinary Shares Number & 1377000 & 1383000 & 1380000 & 1391000 \\ \hline Treasury Shares Number & 490000 & 484000 & 487000 & 476000 \\ \hline \end{tabular} PEPSI - STATEMENT OF CASH FLOWS \begin{tabular}{|c|c|c|c|c|} \hline Breakdown & 30/12/2022 & 30/12/2021 & 30/12/2020 & 30/12/2019 \\ \hline Operating Cash Flow & 10811000 & 11616000 & 10613000 & 9649000 \\ \hline Cash Flow from Continuing Operating Activities & 10811000 & 11616000 & 10613000 & 9649000 \\ \hline Net Income from Continuing Operations & 8978000 & 7679000 & 7175000 & 7353000 \\ \hline Operating Gains Losses & -2902000 & 123000 & 408000 & 519000 \\ \hline Gain Loss On Sale of Business & -3321000 & & & \\ \hline Pension And Employee Benefit Expense & 419000 & 123000 & 408000 & 519000 \\ \hline Depreciation Amortization Depletion & 3280000 & 3215000 & 2548000 & 2432000 \\ \hline Deferred Tax & -787000 & 488000 & 361000 & 445000 \\ \hline Asset Impairment Charge & 3618000 & & & \\ \hline Stock based compensation & 343000 & 301000 & 264000 & 237000 \\ \hline Other non-cash items & -522000 & -599000 & 238000 & -435000 \\ \hline Change in working capital & -888000 & 718000 & -303000 & -479000 \\ \hline Change in Receivables & -1763000 & -651000 & -420000 & -650000 \\ \hline Change in Inventory & -1142000 & -582000 & -516000 & -190000 \\ \hline Change in Prepaid Assets & 118000 & 159000 & 26000 & -87000 \\ \hline Change in Payables And Accrued Expense & 1899000 & 1792000 & 607000 & 448000 \\ \hline Change in Payable & 1899000 & 1792000 & 607000 & 448000 \\ \hline Taxes Refund Paid & -309000 & -309000 & -78000 & -423000 \\ \hline Investing Cash Flow & -2430000 & -3269000 & -11619000 & -6437000 \\ \hline Cash Flow from Continuing Investing Activities & -2430000 & -3269000 & -11619000 & -6437000 \\ \hline Capital Expenditure Reported & -5207000 & -4625000 & -4240000 & -4232000 \\ \hline Net PPE Purchase And Sale & 251000 & 166000 & 55000 & 170000 \\ \hline Sale of PPE & 251000 & 166000 & 55000 & 170000 \\ \hline Net Business Purchase And Sale & 2632000 & 108000 & -6368000 & -2464000 \\ \hline Purchase of Business & -873000 & -61000 & -6372000 & -2717000 \\ \hline Sale of Business & 3505000 & 169000 & 4000 & 253000 \\ \hline Net Investment Purchase And Sale & -117000 & 1077000 & -1108000 & 97000 \\ \hline Purchase of Investment & -291000 & -58000 & -1135000 & 0 \\ \hline Sale of Investment & 174000 & 1135000 & 27000 & 97000 \\ \hline Net Other Investing Changes & 11000 & 5000 & 42000 & -8000 \\ \hline Financing Cash Flow & -8523000 & -10780000 & 3819000 & -8489000 \\ \hline Cash Flow from Continuing Financing Activities & -8523000 & -10780000 & 3819000 & -8489000 \\ \hline Net Issuance Payments of Debt & -810000 & -4132000 & 11293000 & -355000 \\ \hline Net Long Term Debt Issuance & -797000 & -4177000 & 10879000 & -356000 \\ \hline Net Short Term Debt Issuance & -13000 & 45000 & 414000 & 1000 \\ \hline Net Common Stock Issuance & -1500000 & -106000 & -2000000 & -3000000 \\ \hline Common Stock Payments & -1500000 & -106000 & -2000000 & -3000000 \\ \hline Net Preferred Stock Issuance & - & & & 0 \\ \hline Preferred Stock Payments & - & & & 0 \\ \hline Cash Dividends Paid & -6172000 & -5815000 & -5509000 & -5304000 \\ \hline Common Stock Dividend Paid & -6172000 & -5815000 & -5509000 & -5304000 \\ \hline Proceeds from Stock Option Exercised & 138000 & 185000 & 179000 & 329000 \\ \hline Net Other Financing Charges & -179000 & -912000 & -144000 & -159000 \\ \hline End Cash Position & 5100000 & 5707000 & 8254000 & 5570000 \\ \hline Changes in Cash & -142000 & -2433000 & 2813000 & -5277000 \\ \hline Effect of Exchange Rate Changes & -465000 & -114000 & -129000 & 78000 \\ \hline Beginning Cash Position & 5707000 & 8254000 & 5570000 & 10769000 \\ \hline Income Tax Paid Supplemental Data & 2766000 & 1933000 & 1770000 & 2226000 \\ \hline Interest Paid Supplemental Data & 1043000 & 1184000 & 1156000 & 1076000 \\ \hline Capital Expenditure & -5207000 & -4625000 & -4240000 & -4232000 \\ \hline Issuance of Debt & 5346000 & 4564000 & 17886000 & 4627000 \\ \hline Repayment of Debt & -6156000 & -8696000 & -6593000 & -4982000 \\ \hline Repurchase of Capital Stock & -1500000 & -106000 & -2000000 & -3000000 \\ \hline Free Cash Flow & 5604000 & 6991000 & 6373000 & 5417000 \\ \hline \end{tabular}


