Answered step by step
Verified Expert Solution
Link Copied!

Question

1 Approved Answer

and a line for 1) A cost-volume-profit graph has a line for A) revenues: variable costs only B) revenues; fixed costs only C) revenues; total

image text in transcribed
and a line for 1) A cost-volume-profit graph has a line for A) revenues: variable costs only B) revenues; fixed costs only C) revenues; total costs D) net profit; net loss 2) The break-even point on the cost-volume-profit graph is where the A) total cost line intersects the net profit line B) total cost line intersects the net loss line C) revenue line intersects the total cost line D) revenue line intersects the variable cost line 3) If a company faces declining sales over time, it must restructure its costs to break-even at a lower volume. In order to carry this out, what costs can be reduced? A) variable costs only B) fixed costs only C) variable and fixed costs D) step costs only 4) The horizontal axis on the cost-volume-profit graph is the A) dollars of cost B) sales volume in units C) dollars of revenue D) net income 5) The vertical axis on the cost-volume-profit graph is the A) dollars of net profit B) sales volume in units C) margin of safety D) dollars of cost and revenue

Step by Step Solution

There are 3 Steps involved in it

Step: 1

blur-text-image

Get Instant Access to Expert-Tailored Solutions

See step-by-step solutions with expert insights and AI powered tools for academic success

Step: 2

blur-text-image

Step: 3

blur-text-image

Ace Your Homework with AI

Get the answers you need in no time with our AI-driven, step-by-step assistance

Get Started

Recommended Textbook for

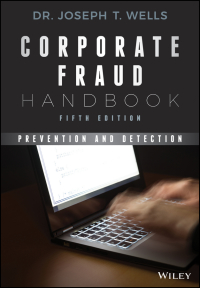
Corporate Fraud Prevention And Detection

Authors: Joseph T. Wells

5th Edition

1119351987, 9781119351986

More Books

Students also viewed these Accounting questions

Question

1 What is meant by systematic training?

Answered: 1 week ago