Answered step by step
Verified Expert Solution
Question
1 Approved Answer
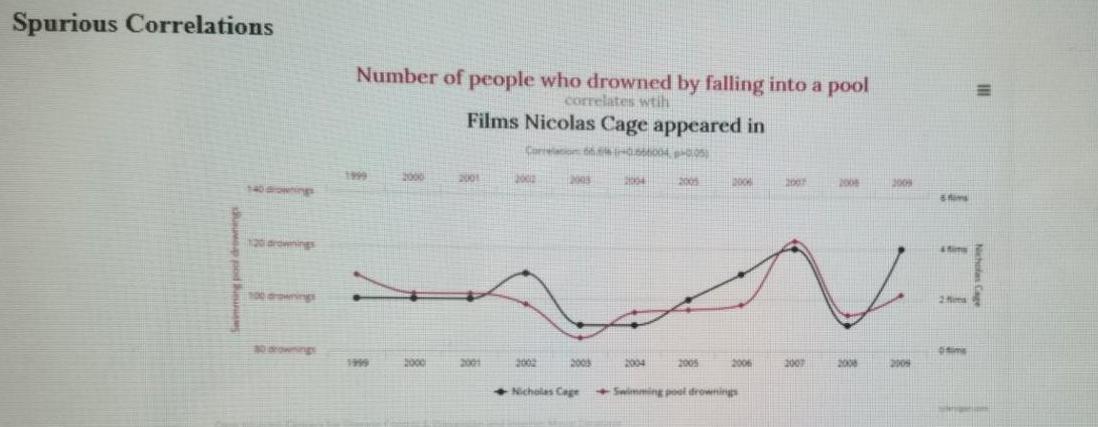
and at least one conclusion you could draw from the graph. Are you 1. Describe the graph shown convinced of this conclusion? 2. What


and at least one conclusion you could draw from the graph. Are you 1. Describe the graph shown convinced of this conclusion? 2. What is the primary mistake people make when interpreting correlation coefficients? Spurious Correlations 140 drownings 100 drownings Number of people who drowned by falling into a pool correlates wtih 1999 1999 2000 2000 Films Nicolas Cage appeared in Correlation 66+0.566004, p.05; pH005) 2001 2001 2002 2005 2002 Nicholas Cage 2004 2005 2005 2004 2006 2005 2006 200 Swimming pool drownings 2007 2008 2008 2009 toms & fims 3 2 fis Otime lengtom
Step by Step Solution
★★★★★
3.45 Rating (145 Votes )
There are 3 Steps involved in it
Step: 1
1 The graph shows a weakly positive correlation on average between the number of people who drowned falling in the pool and films Nicholas Cage appear...
Get Instant Access to Expert-Tailored Solutions
See step-by-step solutions with expert insights and AI powered tools for academic success
Step: 2

Step: 3

Ace Your Homework with AI
Get the answers you need in no time with our AI-driven, step-by-step assistance
Get Started


