Question
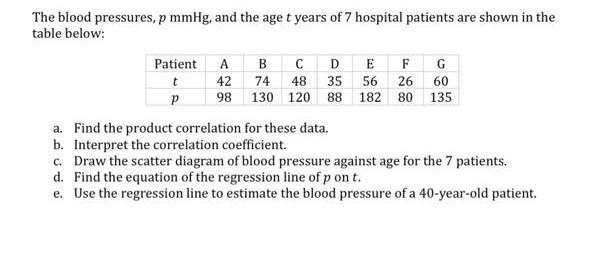
The blood pressures, p mmHg, and the age t years of 7 hospital patients are shown in the table below: Patient t A B

The blood pressures, p mmHg, and the age t years of 7 hospital patients are shown in the table below: Patient t A B 42 D E F G 74 48 35 56 26 60 98 130 120 88 182 80 135 a. Find the product correlation for these data. b. Interpret the correlation coefficient. c. Draw the scatter diagram of blood pressure against age for the 7 patients. d. Find the equation of the regression line of p on t. e. Use the regression line to estimate the blood pressure of a 40-year-old patient.
Step by Step Solution
3.55 Rating (162 Votes )
There are 3 Steps involved in it
Step: 1

Get Instant Access to Expert-Tailored Solutions
See step-by-step solutions with expert insights and AI powered tools for academic success
Step: 2

Step: 3

Ace Your Homework with AI
Get the answers you need in no time with our AI-driven, step-by-step assistance
Get StartedRecommended Textbook for
Statistics
Authors: Robert S. Witte, John S. Witte
11th Edition
1119254515, 978-1119254515
Students also viewed these Computer Network questions
Question
Answered: 1 week ago
Question
Answered: 1 week ago
Question
Answered: 1 week ago
Question
Answered: 1 week ago
Question
Answered: 1 week ago
Question
Answered: 1 week ago
Question
Answered: 1 week ago
Question
Answered: 1 week ago
Question
Answered: 1 week ago
Question
Answered: 1 week ago
Question
Answered: 1 week ago
Question
Answered: 1 week ago
Question
Answered: 1 week ago
Question
Answered: 1 week ago
Question
Answered: 1 week ago
Question
Answered: 1 week ago
Question
Answered: 1 week ago
Question
Answered: 1 week ago
Question
Answered: 1 week ago
Question
Answered: 1 week ago
Question
Answered: 1 week ago
View Answer in SolutionInn App


