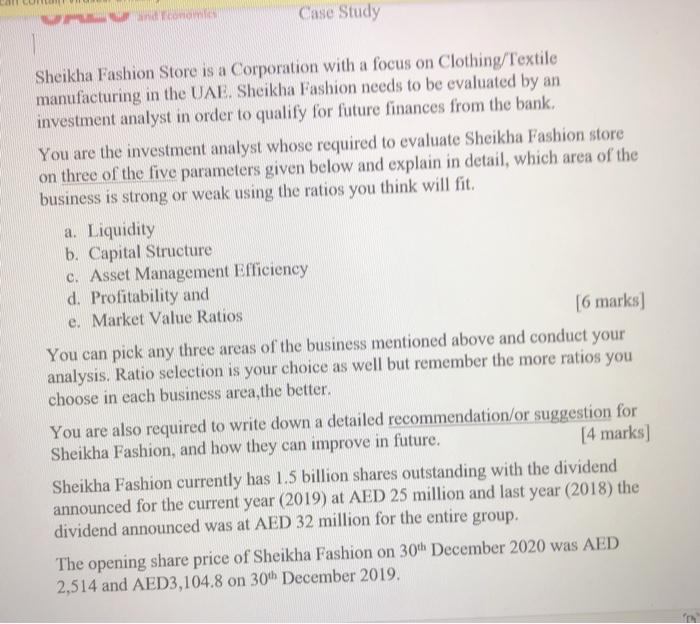
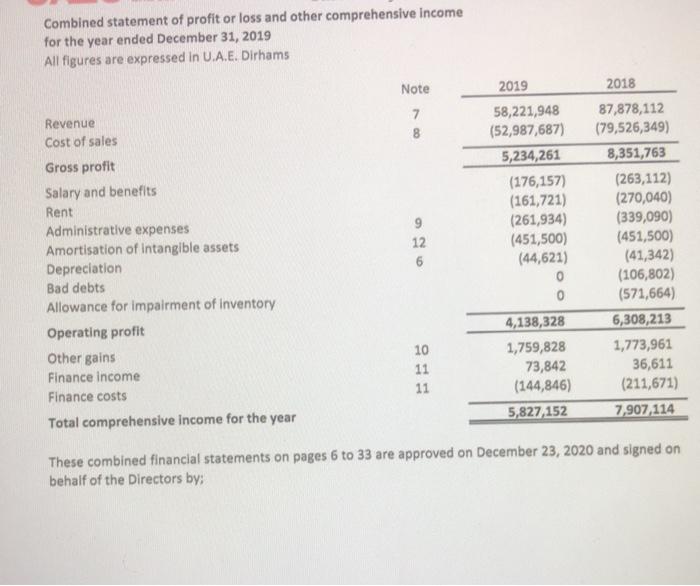
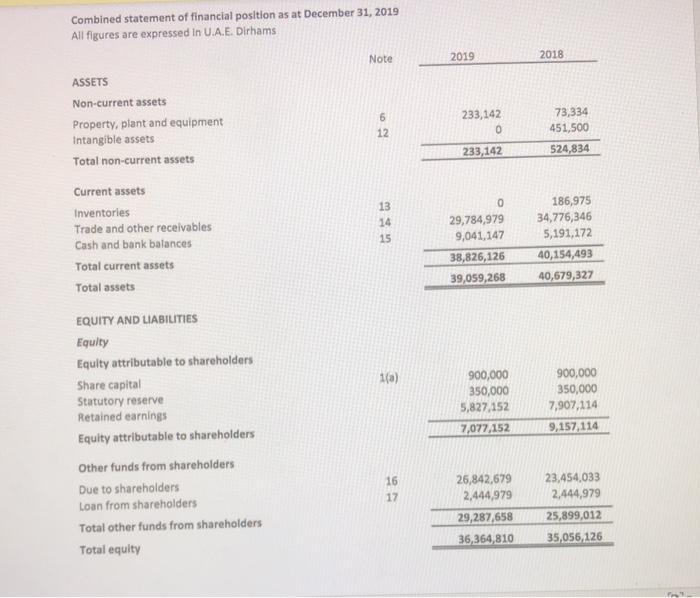
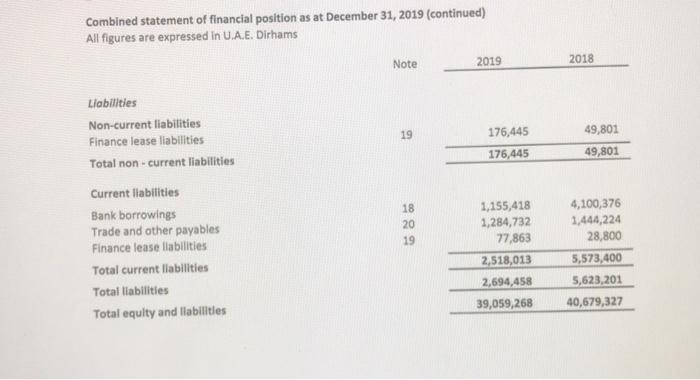
And home Case Study Sheikha Fashion Store is a Corporation with a focus on Clothing/Textile manufacturing in the UAE. Sheikha Fashion needs to be evaluated by an investment analyst in order to qualify for future finances from the bank, You are the investment analyst whose required to evaluate Sheikha Fashion store on three of the five parameters given below and explain in detail, which area of the business is strong or weak using the ratios you think will fit. a. Liquidity b. Capital Structure c. Asset Management Efficiency d. Profitability and e. Market Value Ratios [6 marks) You can pick any three areas of the business mentioned above and conduct your analysis. Ratio selection is your choice as well but remember the more ratios you choose in each business area, the better. You are also required to write down a detailed recommendation/or suggestion for Sheikha Fashion, and how they can improve in future. (4 marks] Sheikha Fashion currently has 1.5 billion shares outstanding with the dividend announced for the current year (2019) at AED 25 million and last year (2018) the dividend announced was at AED 32 million for the entire group. The opening share price of Sheikha Fashion on 30th December 2020 was AED 2,514 and AED3,104.8 on 30th December 2019, Combined statement of profit or loss and other comprehensive Income for the year ended December 31, 2019 All figures are expressed in 0.A.E. Dirhams 2019 2018 Note 7 8 9 12 6 Revenue Cost of sales Gross profit Salary and benefits Rent Administrative expenses Amortisation of intangible assets Depreciation Bad debts Allowance for impairment of inventory Operating profit Other gains Finance income Finance costs Total comprehensive income for the year 58,221,948 (52,987,687) 5,234,261 (176,157) (161,721) (261,934) (451,500) (44,621) 0 0 4,138,328 1,759,828 73,842 (144,846) 5,827,152 87,878,112 (79,526,349) 8,351,763 (263,112) (270,040) (339,090) (451,500) (41,342) (106,802) (571,664) 6,308,213 1,773,961 36,611 (211,671) 7,907, 114 10 11 11 These combined financial statements on pages 6 to 33 are approved on December 23, 2020 and signed on behalf of the Directors by: Combined statement of financial position as at December 31, 2019 All figures are expressed in U.A.E. Dirhams Note 2019 2018 ASSETS 6 12 233,142 0 Non-current assets Property, plant and equipment Intangible assets Total non-current assets 73,334 451,500 233,142 524,834 Current assets Inventories Trade and other receivables Cash and bank balances Total current assets Total assets 13 14 15 0 29,784,979 9,041,147 38,826,126 39,059,268 186,975 34,776,346 5,191,172 40,154,493 40,679,327 1(a) EQUITY AND LIABILITIES Equity Equity attributable to shareholders Share capital Statutory reserve Retained earnings Equity attributable to shareholders Other funds from shareholders Due to shareholders Loan from shareholders Total other funds from shareholders Total equity 900,000 350,000 5,827,152 7,077,152 900,000 350,000 7,907,114 9,157,114 16 17 26,842,679 2,444,979 29,287,658 36,364,810 23,454,033 2,444,979 25,899,012 35,056,126 Combined statement of financial position as at December 31, 2019 (continued) All figures are expressed in U.A.E. Dirhams Note 2019 2018 19 176,445 176,445 49,801 49,801 Liabilities Non-current liabilities Finance lease liabilities Total non-current liabilities Current liabilities Bank borrowings Trade and other payables Finance leasellabilities Total current liabilities Totaf liabilities Total equity and liabilities 18 20 19 1,155,418 1,284,732 77,863 2,518,013 2,694,458 39,059,268 4,100,376 1,444,224 28,800 5,573,400 5,623,201 40,679,327
