

Answered step by step
Verified Expert Solution
Question
1 Approved Answer
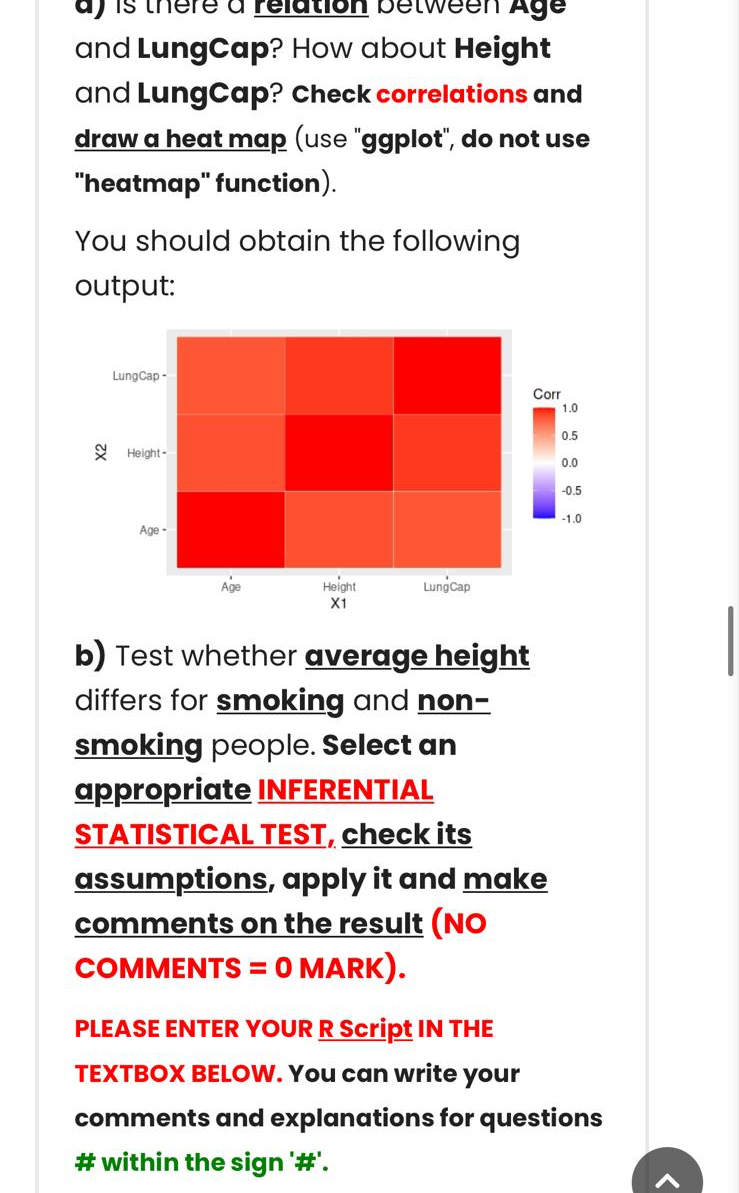
and LungCap? How about Height and LungCap? Check correlations and draw a heat map ( use ggplot, do not use heatmap function ) . You
and LungCap? How about Height and LungCap? Check correlations and draw a heat map use "ggplot", do not use "heatmap" function
You should obtain the following output:
b Test whether average height differs for smoking and nonsmoking people. Select an appropriate INFERENTIAL STATISTICAL TEST, check its assumptions, apply it and make comments on the result NO COMMENTS MARK
PLEASE ENTER YOUR R Script IN THE TEXTBOX BELOW. You can write your comments and explanations for questions # within the sign #
Step by Step Solution
There are 3 Steps involved in it
Step: 1

Get Instant Access to Expert-Tailored Solutions
See step-by-step solutions with expert insights and AI powered tools for academic success
Step: 2

Step: 3
Ace Your Homework with AI
Get the answers you need in no time with our AI-driven, step-by-step assistance
Get Started
Big Data, Mining, And Analytics Components Of Strategic Decision Making
Authors: Stephan Kudyba
1st Edition
1466568704, 9781466568709