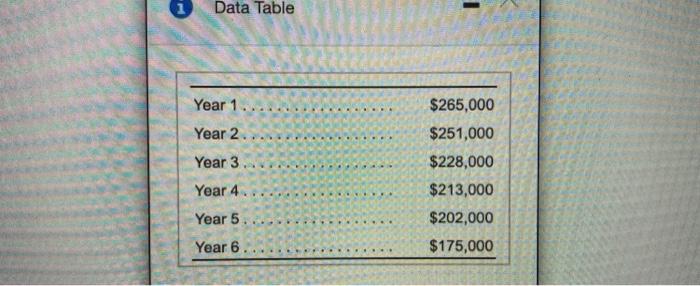
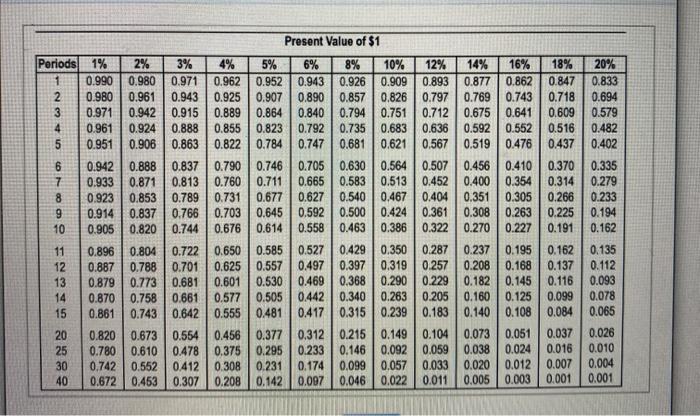
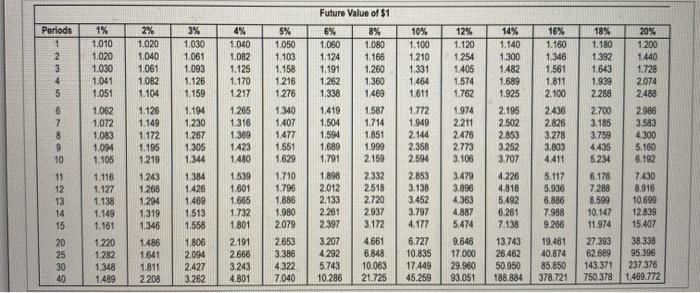
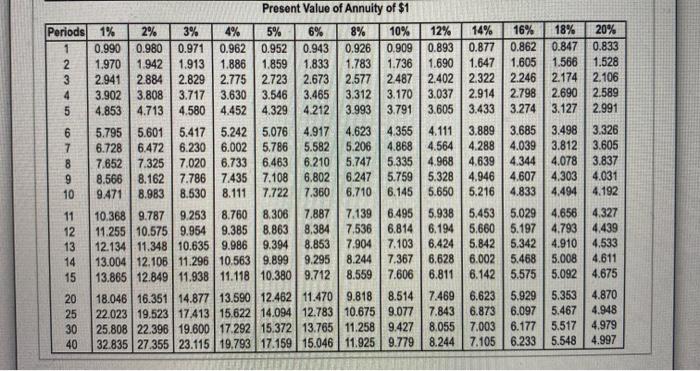
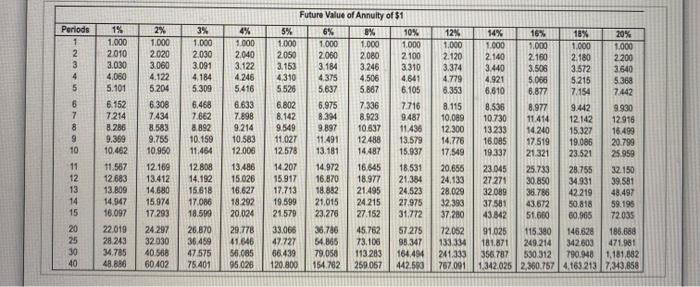
Anderson Industries is deciding water to automate on phase of its production process. The manufacturing equipment has a six-year life and will cont 5915,000. Projected net caur shows are as follow Click the icon to view the projected net cash inflows) (Click the loon to view the present value table) (Click on to the procent value annuity tabi) (Click the icon to view the future valce table.) Click the icon to view the Mure veauty Read the grants 1. Compute this project's NPV using Anderson Industries' 14% hurdle rate. Should the company invest in the equipment? Why or why not? 2. Anderson Industries could refurbish the equipment at the end of six years for $102,000. The refurbished equipment could be used one more year, providing $78,000 of net cash inflows in Year 7. In addition, the refurbished equipment would have a $53,000 residual value at the end of Year 7. Should Anderson Industries invest in the equipment and refurbish it after six years? Why or why not? (Hint: In addition to your answer to Requirement 1, discount the additional cash outflow and inflows back to the present value.) Data Table Year 1 Year 2 $265,000 $251,000 $228,000 $213,000 Year 3 Year 4. Year 5 $202,000 Year 6 $175,000 h N Present Value of $1 Periods 1% 2% 3% 4% 5% 6% 8% 10% 12% 14% 16% 18% 20% 1 0.990 0.980 0.971 0.962 0.952 0.943 0.926 0.909 0.893 0.877 0.862 0.847 0.833 0.980 0.961 0.943 0.925 0.907 0.890 0.857 0.826 0.797 0.769 0.743 0.718 0.694 3 0.971 0.942 0.915 0.889 0.864 0.840 0.794 0.751 0.712 0.675 0.641 0.609 0.579 4 0.961 0.924 0.888 0.855 0.823 0.792 0.735 0.683 0.636 0.592 0.552 0.516 0.482 0.951 0.906 0.863 0.822 0.784 0.747 0.681 0.621 0.567 0.519 0.476 0.437 0.402 6 0.942 0.888 0.837 0.790 0.746 0.705 0.630 0.564 0.507 0.4560.410 0.370 0.335 7 0.933 0.871 0.813 0.760 0.711 0.665 0.583 0.513 0.452 0.400 0.354 0.314 0.279 8 0.923 0.853 0.789 0.731 0.677 0.627 0.540 0.467 0.404 0.351 0.305 0.266 0.233 9 0.914 | 0.837 0.766 0.703 0.645 0.592 0.500 0.424 0.361 0.308 0.263 0.225 0.194 10 0.905 0.820 0.744 0.676 0.614 0.558 0.463 0.386 0.322 0.270 0.227 0.191 0.162 11 0.896 0.804 0.722 0.650 0.585 0.527 0.429 0.350 0.287 0.237 0.195 0.162 0.135 12 0.887 0.788 0.701 0.625 0.557 0.497 0.397 0.319 0.257 0.208 0.168 0.137 0.112 13 0.879 0.773 0.681 0.601 0.530 0.469 0.368 0.290 0.229 0.182 0.145 0.116 0.093 14 0.870 0.758 0.661 0.505 0.442 0.340 0.263 0.205 0.160 0.125 0.099 0.078 15 0.861 0.743 0.642 0.555 0.481 0.417 0.315 0.239 0.183 0.140 0.108 0.084 0.065 20 0.820 0.673 0.554 0.456 0.377 0.312 0.215 0.149 0.104 0.073 0.051 0.037 0.028 25 0.780 0.610 0.478 0.375 0.295 0.233 0.146 0.092 0.059 0.038 0.024 0.016 0.010 30 0.742 0.5520412 0.308 0.231 0.174 0,099 0.057 0.033 0.0200.012 0.007 0.004 40 0.672 0.453 0.307 0.208 0.142 0.007 0.046 0.022 0.011 0.005 0.003 0.001 0.001 0.577 Periods 1 2 3 5 1% 1.010 1.020 1.030 1.041 1.051 1.062 1,072 1.083 1094 6 2% 1.020 1040 1.061 1.082 1.104 1.126 1.149 1.172 1.195 1.219 1.243 1.268 1.294 1.319 1.346 1486 1641 1.811 2208 5% 1.050 1.103 1.158 1216 1276 1.340 1407 1477 1551 1629 1.710 8 3% 1.030 1.061 1.093 1.126 1.159 1.194 1230 1.267 1.305 1.344 1,384 1.426 1.409 1.513 1,558 1.806 2094 2427 3.262 4% 1.040 1,082 1.125 1.170 1217 1.265 1.316 1.369 1423 1.480 1.539 1.601 1.665 1.732 1.801 2191 2666 3.243 4.B01 Future Value of $1 6% 8% 1.060 1.080 1 124 1.168 1.191 1.260 1.262 1.360 1.338 1.469 1.419 1,587 1.504 1.714 1.594 1.851 1.689 1.999 1.791 2.159 1.898 2332 2.012 2518 2.133 2720 2.261 2937 2.397 3.172 3.207 4.661 4.292 6.848 5.743 10.063 10.286 21.725 1.105 14% 1.140 1.300 1482 1.689 1.925 2.195 2502 2853 3.252 3.707 10% 1.100 1.210 1,331 1.464 1.611 1.772 1.949 2144 2358 2.594 2853 3.138 3.452 3.797 4.177 6.727 10.835 17.449 45.259 12% 1.120 1.254 1.405 1 574 1.762 1.974 2211 2478 2.773 3.106 3.479 3.890 4.363 4.887 5.474 9.646 17.000 29.960 93.051 16% 1.160 1.346 1.561 1.811 2.100 2436 2826 3.278 3.803 4411 5.117 5.936 8.886 7.988 9.286 19.461 40.874 85.850 378.721 18% 20% 1.180 1.200 1 392 1440 1.643 1.728 1.939 2.074 2.288 2488 2.700 2986 3.185 3.583 3.759 4300 4.435 5.160 5.234 6.192 6.176 7288 8.918 8.599 10.699 10.147 12.839 11.974 15.407 27.393 38.338 62.689 95 396 143.371 237 378 750.378 1.469.772 7.430 1.796 11 12 13 14 15 20 25 30 40 1.116 1.127 1.138 1.149 1.161 4.226 4.818 5.492 6.261 7.138 13.743 26.462 50950 188.884 1.888 1.980 2079 2653 3.386 4322 7.040 1.220 1.282 1.348 1.489 Periods 1 2 3 4 5 6 7 9 10 Present Value of Annuity of $1 1% 2% 3% 4% 5% 6% 8% 10% 12% 0.990 0.980 0.971 0.962 0.952 0.943 0.926 0.909 0.893 1.970 1.942 1.913 1.886 1.859 1.833 1.783 1.736 1.690 2.941 2.884 | 2.829 2.775 2.723 2.673 2.577 2487 2.402 3.902 3.808 3.717 3.630 3.546 3.465 3.312 3.170 3.037 4.853 4.713 4.580 4.452 4.329 4.212 3.993 3.791 3.605 5.795 5.601 5.417 5.2425.076 4.917 4.623 4.355 4.111 6.728 6.472 6.230 6.0025.786 5.582 5.206 4.868 4.564 7.652 7.325 7.020 6.733 6.463 6.210 5.747 5.335 4.968 8.566 8.1627.786 7.435 7.108 6.802 6.247 5.759 5.328 9.471 8.983 8.530 8.111 7.722 7.360 6.710 6.145 5.650 10.368 9.787 9.253 8.760 8.306 7.887 7.139 6.495 5.938 11.255 10.575 9.954 9.3858.863 8.384 7.536 6.814 6.194 12.134 11.348 10.635 9.986 9.394 8.853 7.904 7.103 6.424 13.004 12.106 11.296 10.563 9.899 9.295 8.244 7.367 6.628 13.865 12.849 11.938 11.118 10.380 9.712 8.559 7.606 6.811 18.046 16.351 14.877 13.590 12.462 11.470 9.818 8.514 7.469 22.02319,523 17.41315.622 14.094 12.783 10.675 9.077 7.843 25.80822.396 19.600 17.292 15.372 13.765 11.2589.4278.055 32.835 27.355 23.115 19.793 17.159 15.046 11.925 9.779 8.244 14% 16% 18% 20% 0.877 0.862 0.847 0.833 1.647 1.605 1.566 1.528 2.322 2.246 2.174 2.106 2.914 2.798 2.690 2.589 3.433 3.274 3.127 2.991 3.889 3.685 3.498 3.326 4.288 4.039 3.812 3.605 4.639 4.344 4.078 3.837 4.946 4.6074.303 4.031 5.216 4.833 4.494 4.192 5.4535.0294.656 4.327 5,6605.1974.793 4.439 5.842 5.342 4.910 4.533 6.002 5.468 5.008 4.611 6.142 5.575 5.092 4.675 6.623 5.929 5.353 4.870 6.873 6.097 5.467 4.948 7.003 6.177 5.517 4.979 7.105 6.233 5.548 4.997 11 12 13 14 15 20 25 30 40 Periods 1 2 3 4 5 12% 1.000 2.120 3.374 4.779 6.353 6 7 9 10 1% 1.000 2010 3.030 4.080 5.101 6.152 7214 8.286 9.369 10.462 11.567 12.683 13.809 14.947 16.097 22.019 28.243 44.785 48.886 2% 1.000 2020 3.060 4.122 5.204 6308 7434 8.583 9.755 10.950 12169 13.412 14.680 15,974 17293 24.297 32030 40.568 60402 3% 1.000 2030 3.091 4.184 5.309 6.468 7.662 8.892 10.159 11.464 12808 14.192 15.618 17.086 18.599 26.870 36.459 47575 75.401 4% 1.000 2.040 3.122 4.246 5416 6.633 7.898 9.214 10.583 12.000 13486 15.026 16.627 18.292 20.024 Future Value of Annuity of $1 5% 6% 10% 1.000 1.000 1,000 1.000 2050 2060 2,080 2100 3.153 3.184 3.246 3.310 4.310 4.375 4.506 4.641 5526 5.637 5,867 6.105 6.802 6.975 7.336 7.716 8.142 8.394 8.923 9.487 9.549 9.897 10.637 11.436 11.027 11.491 12488 13.579 12.578 13.181 14487 15.937 14.207 14.972 16.545 18.531 15 917 16.870 18.977 21,384 17.713 18.882 21.495 24.523 19.599 21.015 24.215 27.975 21.579 23.276 27.152 31.772 33.068 36.786 45.762 57 275 47.727 54.366 73.100 10.347 66.439 79.058 113283 164,494 120.800 154.782 259,057 442.503 14% 16% 18% 20% 1.000 1.000 1.000 1.000 2.140 2160 2.180 2200 3.440 3.508 3.572 3.640 4.921 5.080 5.215 5.368 6.610 6.877 7.154 7.442 8.536 8.977 9.442 9.930 10730 11.414 12.142 12916 13233 14.240 15.327 16.499 16.085 17.519 19.086 20.799 19337 21321 23.521 25959 23.045 25.733 28.755 32.150 27271 30.850 34.931 39.581 32089 36.786 42.219 48.497 37581 43.672 50.818 59.195 43.842 51.660 60.965 72035 91 115.380 146.62 186.688 181.871 249.214 342.603 471.981 356.787 330.312 790.948 1.181.882 1,342.0252,360.757 4.1632137,343,658 8.115 10,089 12300 14.776 17.549 20.656 24.133 28.029 32,393 37.280 72.052 133 334 241.333 767091 11 12 13 14 15 25 29.778 41.646 (85 95.026 40