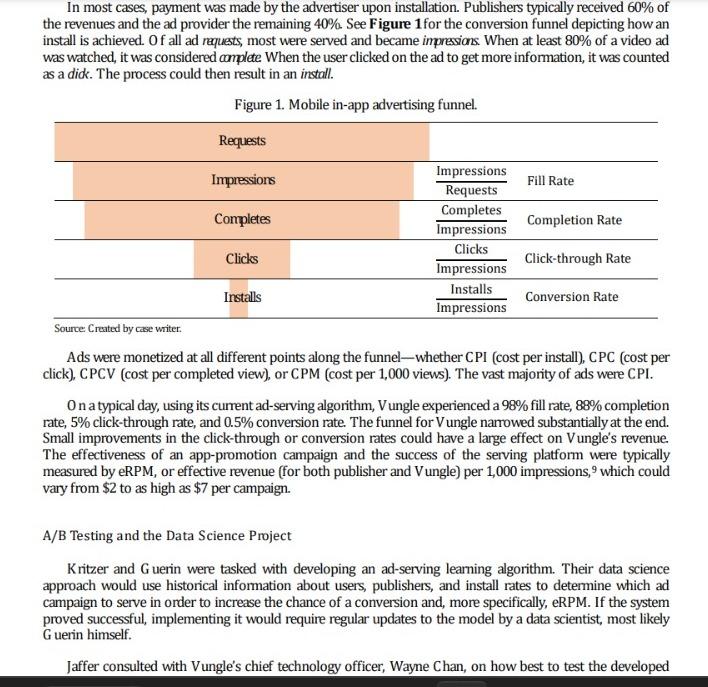
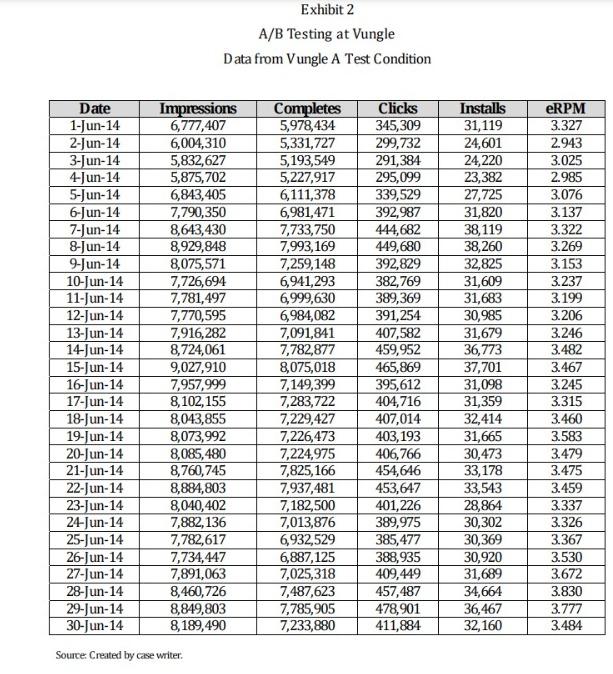
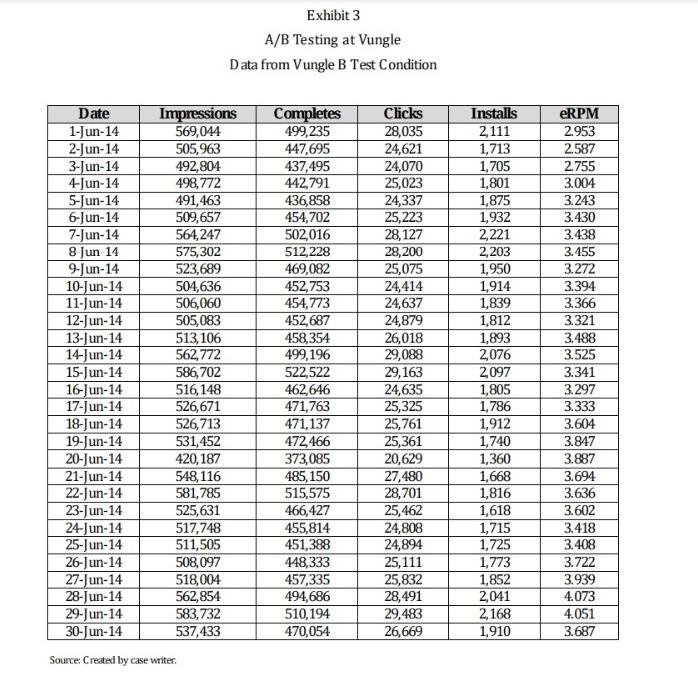
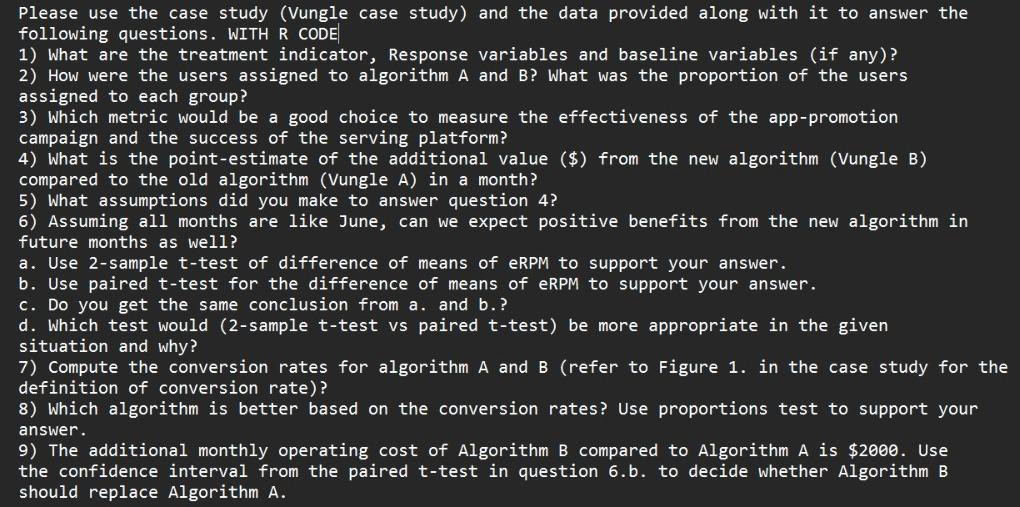
Andrew K ritzer and Hammond G uerin stared at the screen and then at each other. It was June 30, 2014 six weeks since they had graduated from the D arden School of Business. The ad-serving algorithm Kritzer and Guerin had spent six months developing for Vungle, a mobile advertising company, seemed to be outperforming the company's current algorithm. But they did not want to start celebrating too soon. Could their algorithm really deliver the type of improvement they had promised V ungle's CEO? Would install rates of advertised apps really increase? Would Vungle see an increase in ad-serving efficiency as a result? N either Kritzer nor G uerin could afford for the algorithm to disappoint. N ow that he had graduated, K ritzer was headed to LinkedIn, having left a legend among MBA students for his appreciation of data science, tech, and media and raising expectations for what D arden students knew and could learn about data science, analytics, and the ever-growing world of big data His work on the Vungle project during his second year had received a lot of attention, and he was looking forward to having the results support the effort. G uerin's data science capabilities were also legendary among his MBA peers. He won every school forecasting competition, and his data mining algorithms even beat those of the professional consultants who did classroom visits. Late in his second year, G uerin decided to turn down a generous offer from a well-known consulting firm in favor of an offer from Vungle for an annual salary of $100,000 and stock options to serve as the head of Vungle's brand new data science team out in the company's San Francisco headquarters. The job was a dream for the computer scientist tumed MBA. He and his wife were already house hunting in the Bay Area, looking for the right place to raise their baby daughter. Company Overview Vungle was an in-app video advertising company. With 70 employees and $25.5 million from three rounds of investments, V ungle was routinely listed as one of the most promising start-ups operating in Silicon Valley. 1 The three-year-old company offered a platform that embedded video ads in mobile apps to encourage users to download and install additional apps. It was estimated that more than 100 million people saw an advertisement enabled by Vungle each month. 2 Vungle was founded in 2011 by two young entrepreneurs from the United Kingdom, Zain Jaffer and Jack Smith, during their graduate studies at University College London. Initially a video ad production firm, Vungle's expenses in its first year were running too high and revenue was not reaching the founders' expectations. Late in 2011, Jaffer borrowed funds from his then girffriend (and future wife) and his business professor, Bert De Reyck. Each invested $15,000 and the company remained afloat. 3 The turning point for Vungle came in 2012, when the two founders creatively used their own video production technology to get the attention of the San Francisco-based start-up incubator AngelPad. In doing so, they beat 2,000 applicants for the final slot in the incubator program. This opportunity provided Vungle $120,000 in seed funding. Jaffer moved to San Francisco to serve as the firm's CEO and remained in that position. He was profiled in a " 35 Under 35 " list by Inc magazine in 2014.4 The Mobile Advertising Ecosystem: Market, Operations, and Pricing In 2013, the average U.S. consumer spent two hours and 42 minutes on mobile devices per day; 86% of that was spent in apps, the clear dominant form of mobile usage. 5 The growth in the mobile market and the extensive time spent in apps introduced a new advertising channel. According to the Mobile Marketing Association, 75% of ads served to mobile consumers in 2013 were served while they were using apps. 6 Mobile in-app ads experienced a 60\% annual growth in 2013 and were expected to surpass PC online ad revenues by 2017.7 By 2014, in-app video advertising was replacing mobile banner ads-the latter offered a lower-quality user experience and were typically clicked on accidentally. The in-app video ads were typically 15 seconds long and promoted a new app or product. Apple's iO S system accounted for 80% of ads being served. Video ads peaked during prime-time TV hours. 8 Four parties participated in the in-app mobile advertisement channel. The user of the mobile device (user), the owner of the app being used (publishe'), the sponsor of the video ad the user was exposed to (advetise), and the platform that matched the choice of ad to a specific user (e.g., V unde). In the mobile advertising domain, supply was considered to be the slots available for showing ads, and demand consisted of the advertisers willing to buy the supply by placing ads. When the user launched an app, his or her device would send a request to Vungle for an ad. For instance, suppose user Chris was playing Sonic D ash by the publisher Sega. Vungle's platform would then determine the best ad to serve to Chris while he played Sonic D ash. Assume V ungle decided to serve Chris an ad for the game Hay D ay (the advertiser, see Exhibit 1 for a schematic of this process). Assuming Chris was still playing Sonic D ash when the ad was served, then Chris would see the video for Hay D ay. If Chris was interested in learning more about Hay D ay, he would click on the ad and be redirected to the app store. Chris might then decide to install Hay D ay. In most cases, payment was made by the advertiser upon installation. Publishers typically received 60% of the revenues and the ad provider the remaining 40%. See Figure 1 for the conversion funnel depicting how an install is achieved. of all ad requests, most were served and became impressions. When at least 80% of a video ad was watched, it was considered complete When the user clicked on the ad to get more information, it was counted as a didk. The process could then result in an install. Figure 1. Mobile in-app advertising funnel. source: Lreated by case whiter. Ads were monetized at all different points along the funnel-whether CPI (cost per install), CPC (cost per click), CPCV (cost per completed view), or CPM (cost per 1,000 views). The vast majority of ads were CPI. 0 n a typical day, using its current ad-serving algorithm, V ungle experienced a 98% fill rate, 88% completion rate, 5% click-through rate, and 0.5% conversion rate. The funnel for V ungle narrowed substantially at the end. Small improvements in the click-through or conversion rates could have a large effect on Vungle's revenue. The effectiveness of an app-promotion campaign and the success of the serving platform were typically measured by eRPM, or effective revenue (for both publisher and V ungle) per 1,000 impressions, 9 which could vary from $2 to as high as $7 per campaign. A/B Testing and the Data Science Project Kritzer and G uerin were tasked with developing an ad-serving learning algorithm. Their data science approach would use historical information about users, publishers, and install rates to determine which ad campaign to serve in order to increase the chance of a conversion and, more specifically, eRPM. If the system proved successful, implementing it would require regular updates to the model by a data scientist, most likely G uerin himself. Jaffer consulted with Vungle's chief technology officer, Wayne Chan, on how best to test the developed Exhibit 2 A/B Testing at Vungle Data from Vungle A Test Condition Exhibit 3 A/B Testing at Vungle Data from Vungle B Test Condition Source: Created by case writer. Please use the case study (Vungle case study) and the data provided along with it to answer the following questions. WITH R CODE 1) What are the treatment indicator, Response variables and baseline variables (if any)? 2) How were the users assigned to algorithm A and B? What was the proportion of the users assigned to each group? 3) Which metric would be a good choice to measure the effectiveness of the app-promotion campaign and the success of the serving platform? 4) What is the point-estimate of the additional value (\$) from the new algorithm (Vungle B) compared to the old algorithm (Vungle A) in a month? 5) What assumptions did you make to answer question 4? 6) Assuming all months are like June, can we expect positive benefits from the new algorithm in future months as well? a. Use 2-sample t-test of difference of means of eRPM to support your answer. b. Use paired t-test for the difference of means of eRPM to support your answer. c. Do you get the same conclusion from a. and b.? d. Which test would (2-sample t-test vs paired t-test) be more appropriate in the given situation and why? 7) Compute the conversion rates for algorithm A and B (refer to Figure 1. in the case study for the definition of conversion rate)? 8) Which algorithm is better based on the conversion rates? Use proportions test to support your answer. 9) The additional monthly operating cost of Algorithm B compared to Algorithm A is $2000. Use the confidence interval from the paired t-test in question 6.b. to decide whether Algorithm B should replace Algorithm A


