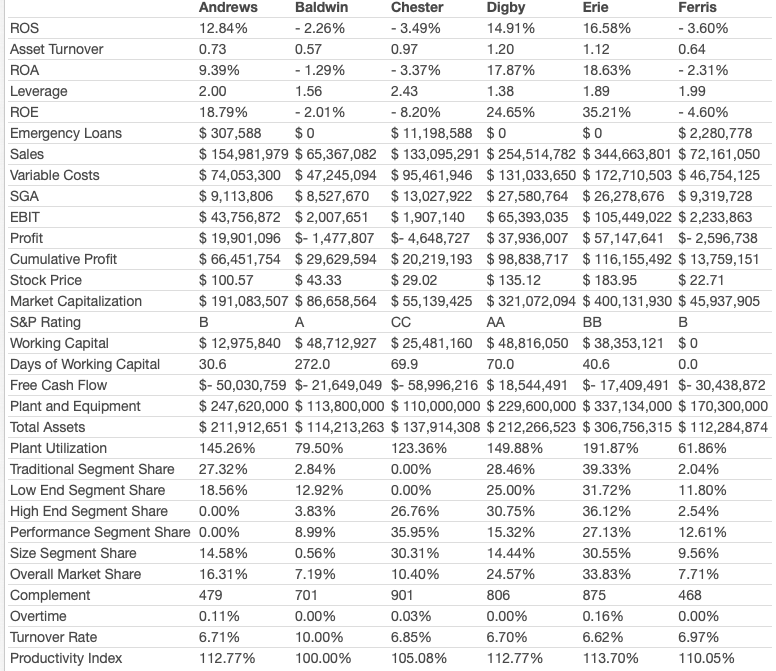
Andrews Baldwin Chester Digby Erie Ferris ROS 12.84% - 2.26% - 3.49% 14.91% 16.58% - 3.60% Asset Turnover 0.73 0.57 0.97 1.20 1.12 0.64 ROA 9.39% - 1.29% - 3.37% 17.87% 18.63% - 2.31% Leverage 2.00 1.56 2.43 1.38 1.89 1.99 ROE 18.79% - 2.01% - 8.20% 24.65% 35.21% - 4.60% Emergency Loans $ 307,588 $0 $ 11, 198,588 $0 $0 $ 2,280,778 Sales $ 154,981,979 $ 65,367,082 $ 133,095,291 $ 254,514,782 $ 344,663,801 $ 72,161,050 Variable Costs $ 74,053,300 $ 47,245,094 $ 95,461,946 $ 131,033,650 $ 172,710,503 $ 46,754,125 SGA $ 9,113,806 $ 8,527,670 $ 13,027,922 $ 27,580,764 $ 26,278,676 $ 9,319,728 EBIT $ 43,756,872 $ 2,007,651 $ 1,907,140 $ 65,393,035 $ 105,449,022 $ 2,233,863 Profit $ 19,901,096 $- 1,477,807 $- 4,648,727 $ 37,936,007 $ 57,147,641 $- 2,596,738 Cumulative Profit $ 66,451,754 $ 29,629,594 $ 20,219,193 $ 98,838,717 $ 116,155,492 $ 13,759,151 Stock Price $ 100.57 $ 43.33 $ 29.02 $ 135.12 $ 183.95 $ 22.71 Market Capitalization $ 191,083,507 $ 86,658,564 $ 55,139,425 $ 321,072,094 $ 400,131,930 $ 45,937,905 S&P Rating B A CC AA BB B Working Capital $ 12,975,840 $ 48,712,927 $ 25,481,160 $ 48,816,050 $ 38,353, 121 $0 Days of Working Capital 30.6 272.0 69.9 70.0 40.6 0.0 Free Cash Flow $- 50,030,759 $- 21,649,049 $- 58,996,216 $ 18,544,491 $- 17,409,491 $- 30,438,872 Plant and Equipment $ 247,620,000 $ 113,800,000 $ 110,000,000 $ 229,600,000 $ 337,134,000 $ 170,300,000 Total Assets $ 211,912,651 $ 114,213,263 $ 137,914,308 $ 212,266,523 $ 306,756,315 $ 112,284,874 Plant Utilization 145.26% 79.50% 123.36% 149.88% 191.87% 61.86% Traditional Segment Share 27.32% 2.84% 0.00% 28.46% 39.33% 2.04% Low End Segment Share 18.56% 12.92% 0.00% 25.00% 31.72% 11.80% High End Segment Share 0.00% 3.83% 26.76% 30.75% 36.12% 2.54% Performance Segment Share 0.00% 8.99% 35.95% 15.32% 27.13% 12.61% Size Segment Share 14.58% 0.56% 30.31% 14.44% 30.55% 9.56% Overall Market Share 16.31% 7.19% 10.40% 24.57% 33.83% 7.71% Complement 479 701 901 806 875 468 Overtime 0.11% 0.00% 0.03% 0.00% 0.16% 0.00% Turnover Rate 6.71% 10.00% 6.85% 6.70% 6.62% 6.97% Productivity Index 112.77% 100.00% 105.08% 112.77% 113.70% 110.05%


