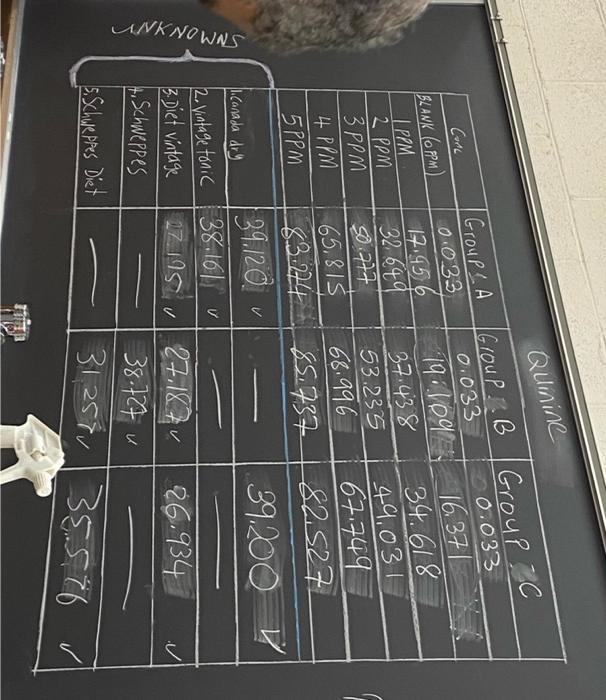
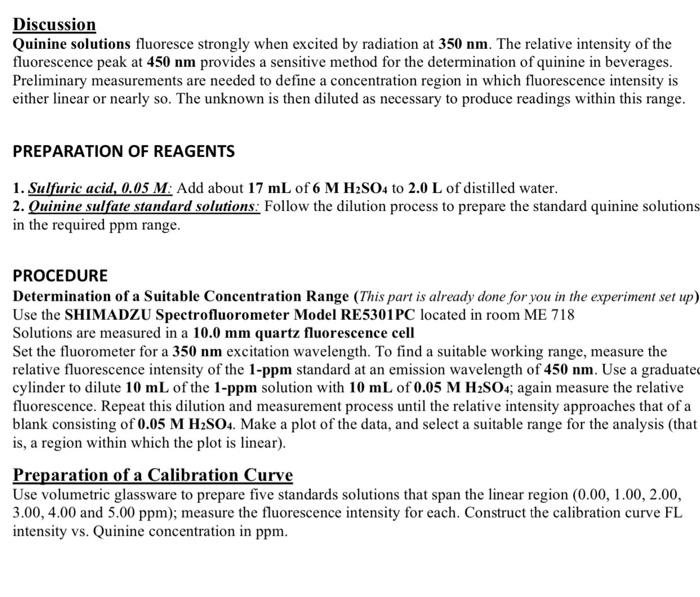
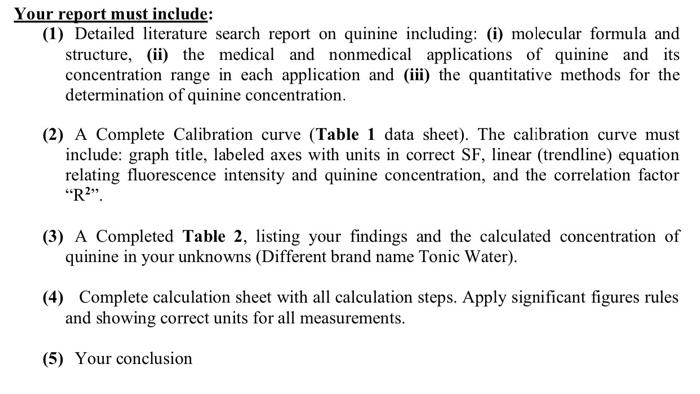
ANKNOWNS Quinine Group C Group B Group A 0.033 0.033 0.033 17.956 19 109 16.371 32.649 37.438 34.618 50.777 53.235 49,031 65.815 68.996 67.749 5PPM 83.274 85.737 82.527 1.Canada dry 39.120 39.200 2. Vintage tonic 38.161 u 3.Diet vintage 27195 27.187 + Schweppes 26.934 38.727 5. Schweppes Diet 31257 35576 Conc BLANK (PPM) | PPM 2 3 PPM 4 PPM V Discussion Quinine solutions fluoresce strongly when excited by radiation at 350 nm. The relative intensity of the fluorescence peak at 450 nm provides a sensitive method for the determination of quinine in beverages. Preliminary measurements are needed to define a concentration region in which fluorescence intensity is either linear or nearly so. The unknown is then diluted as necessary to produce readings within this range. PREPARATION OF REAGENTS 1. Sulfuric acid, 0.05 M: Add about 17 mL of 6 M HSO4 to 2.0 L of distilled water. 2. Quinine sulfate standard solutions: Follow the dilution process to prepare the standard quinine solutions in the required ppm range. PROCEDURE Determination of a Suitable Concentration Range (This part is already done for you in the experiment set up) Use the SHIMADZU Spectrofluorometer Model RE5301PC located in room ME 718 Solutions are measured in a 10.0 mm quartz fluorescence cell Set the fluorometer for a 350 nm excitation wavelength. To find a suitable working range, measure the relative fluorescence intensity of the 1-ppm standard at an emission wavelength of 450 nm. Use a graduated cylinder to dilute 10 mL of the 1-ppm solution with 10 mL of 0.05 M HSO4; again measure the relative fluorescence. Repeat this dilution and measurement process until the relative intensity approaches that of a blank consisting of 0.05 M HSO4. Make a plot of the data, and select a suitable range for the analysis (that is, a region within which the plot is linear). Preparation of a Calibration Curve Use volumetric glassware to prepare five standards solutions that span the linear region (0.00, 1.00, 2.00, 3.00, 4.00 and 5.00 ppm); measure the fluorescence intensity for each. Construct the calibration curve FL intensity vs. Quinine concentration in ppm. Your report must include: (1) Detailed literature search report on quinine including: (i) molecular formula and structure, (ii) the medical and nonmedical applications of quinine and its concentration range in each application and (iii) the quantitative methods for the determination of quinine concentration. (2) A Complete Calibration curve (Table 1 data sheet). The calibration curve must include: graph title, labeled axes with units in correct SF, linear (trendline) equation relating fluorescence intensity and quinine concentration, and the correlation factor "R". (3) A Completed Table 2, listing your findings and the calculated concentration of quinine in your unknowns (Different brand name Tonic Water). (4) Complete calculation sheet with all calculation steps. Apply significant figures rules and showing correct units for all measurements. (5) Your conclusion