Question
Anne Marie has received $500,000 in inheritance and would like to setup a charity (in perpetuity) to help the disadvantaged families by providing 3 scholarships
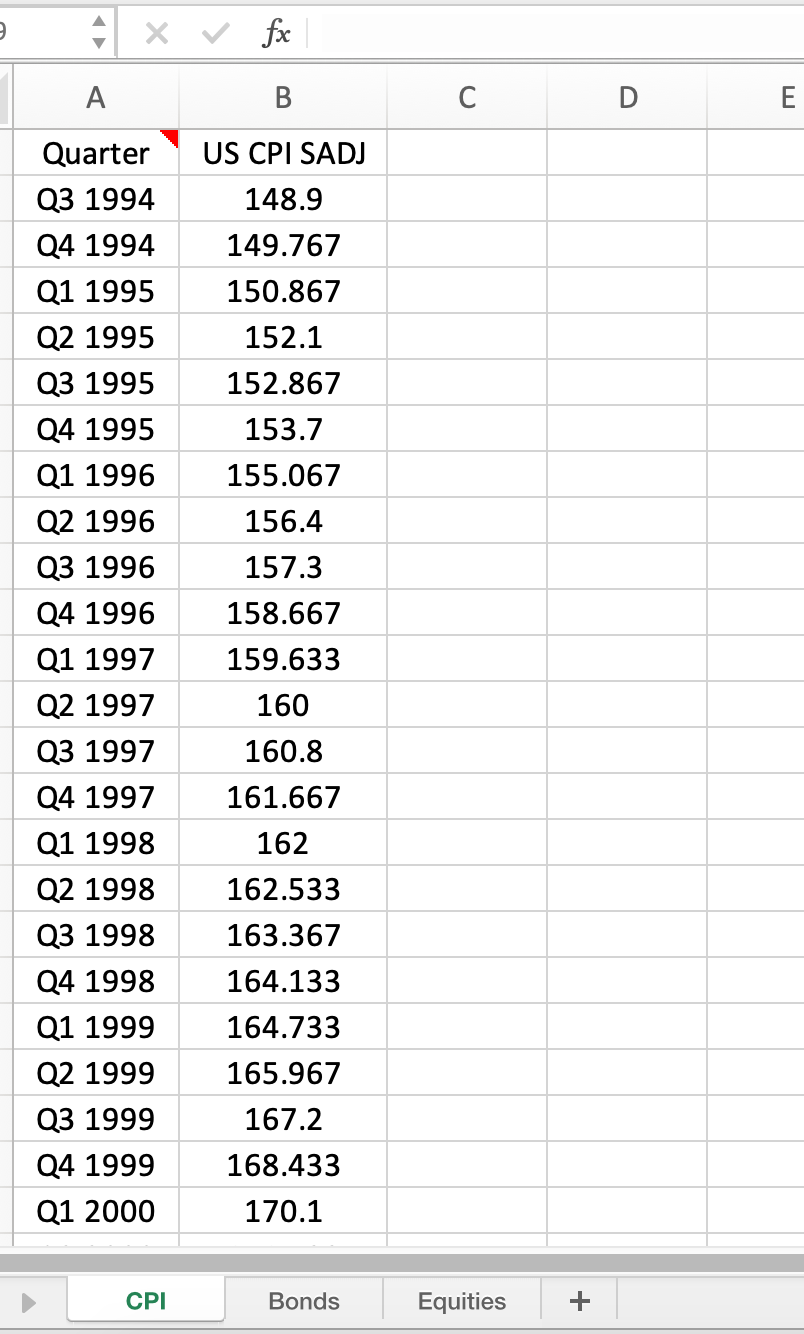
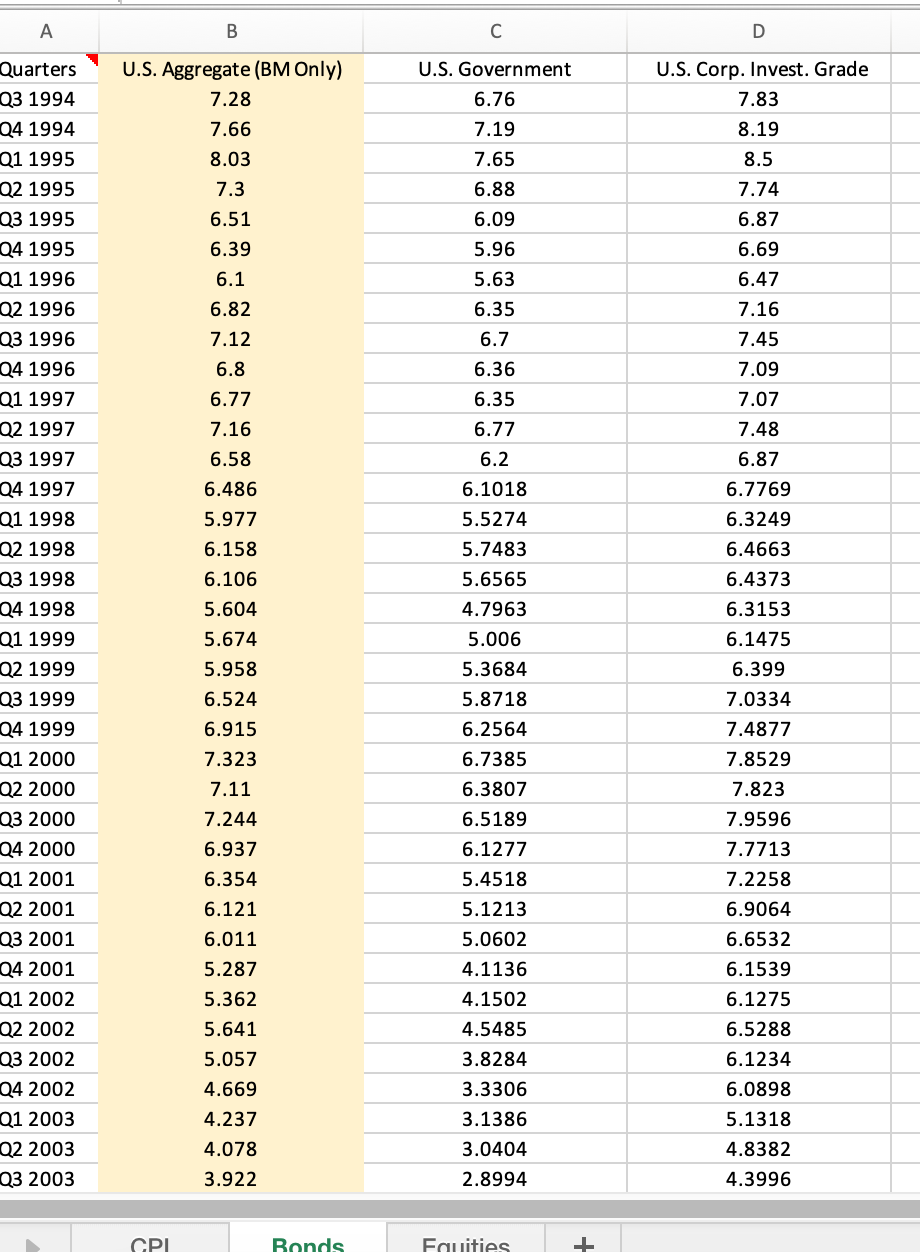
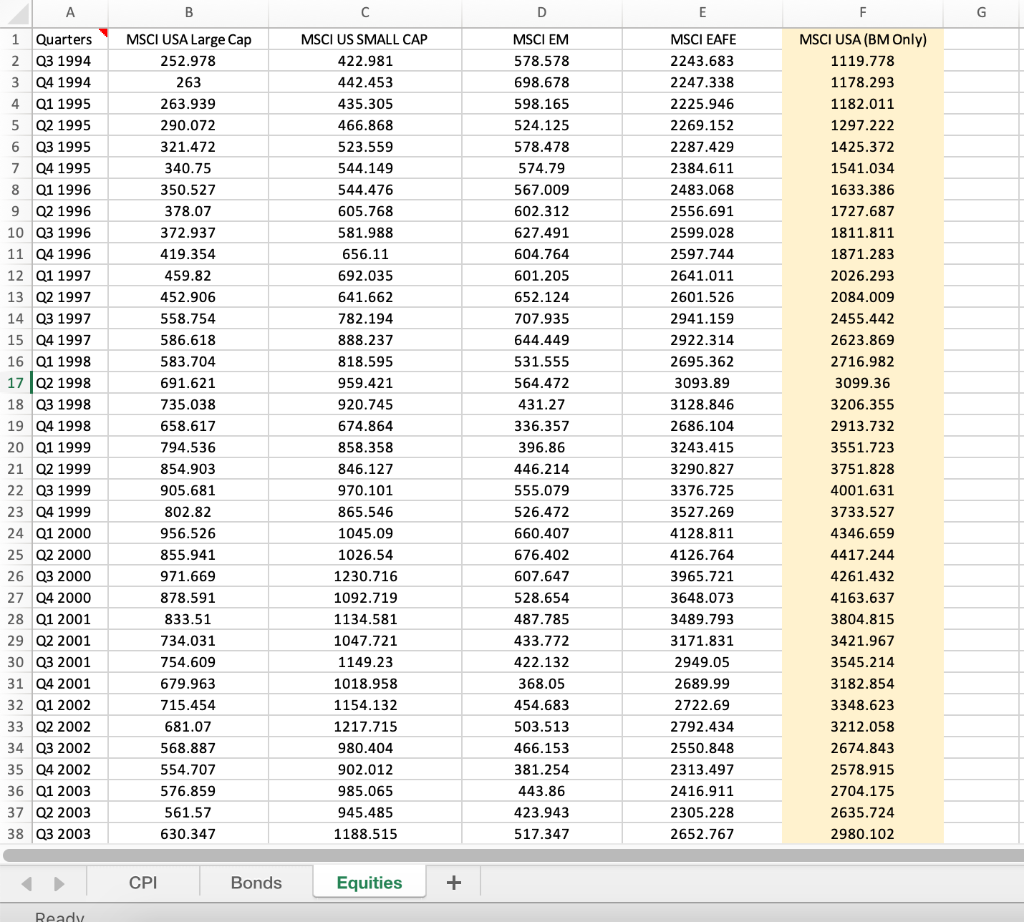
Anne Marie has received $500,000 in inheritance and would like to setup a charity (in perpetuity) to help the disadvantaged families by providing 3 scholarships each year for three deserving high school students. The charity is estimated to cost $6000 for each student each year of charity and will increase with inflation. Anne also wishes that the charity fund should grow in real terms at the rate of 2% per annum and does not expect any further contributions. She estimates that portfolio managers charge 0.5% per annum to manage such an investment scheme. Anne has been provided with two pieces of advice: (i) the charity requires a growth strategy and she should choose a 40:60 (Bonds:Equity) benchmark, and (ii) the charity should have a specific required return objective instead. Anne has sought analysis of the two investment objectives from prospective portfolio management teams. She has requested that all analysis should be conducted on a rolling 8 quarter basis and that investment should have a minimum of 70% of US Bonds and Equities. Emerging markets and Developed markets outside the US should be restricted to equities in large-capitalised firms only. Further, Anne will not invest in any alternative investments, nor will allow the portfolio manager to use derivatives, short positions, or leverage. Cash will not be held by the fund unless it is a residual amount (from sale of assets or remaining yields from equities or bonds) 1. Return objectives that will (i) ensure an annual Spend , pay portfolio management fee of 0.5%, and (iii) potentially provide real growth of the fund on a rolling 8-quarter. 2. Risk objectives should have maximum (in magnitude and ignoring the sign) levels of absolute and relative risk measures established, and the recommended SAAs risk levels must be lower to achieve the investment return objective.


A x fx . B Quarter Q3 1994 Q4 1994 Q1 1995 Q2 1995 Q3 1995 Q4 1995 Q1 1996 Q2 1996 Q3 1996 Q4 1996 Q1 1997 Q2 1997 Q3 1997 Q4 1997 Q1 1998 Q2 1998 Q3 1998 Q4 1998 Q1 1999 Q2 1999 Q3 1999 Q4 1999 Q1 2000 US CPI SADJ 148.9 149.767 150.867 152.1 152.867 153.7 155.067 156.4 157.3 158.667 159.633 160 160.8 161.667 162 162.533 163.367 164.133 164.733 165.967 167.2 168.433 170.1 CPI Bonds Equities + A B D U.S. Aggregate (BM Only) 7.28 U.S. Government 6.76 7.19 7.65 U.S. Corp. Invest. Grade 7.83 8.19 8.5 7.66 8.03 7.3 6.88 7.74 6.51 6.39 6.1 6.09 5.96 5.63 6.35 6.87 6.69 6.47 7.16 6.82 6.7 7.45 6.36 6.35 7.09 7.07 6.77 7.48 6.2 6.87 Quarters Q3 1994 Q4 1994 Q1 1995 Q2 1995 Q3 1995 Q4 1995 Q1 1996 Q2 1996 Q3 1996 Q4 1996 Q1 1997 Q2 1997 Q3 1997 Q4 1997 Q1 1998 Q2 1998 Q3 1998 Q4 1998 Q1 1999 Q2 1999 Q3 1999 Q4 1999 Q1 2000 Q2 2000 Q3 2000 04 2000 Q1 2001 Q2 2001 Q3 2001 Q4 2001 Q1 2002 Q2 2002 Q3 2002 Q4 2002 Q1 2003 Q2 2003 Q3 2003 7.12 6.8 6.77 7.16 6.58 6.486 5.977 6.158 6.106 5.604 5.674 5.958 6.524 6.915 7.323 7.11 7.244 6.937 6.354 6.1018 5.5274 5.7483 5.6565 4.7963 5.006 5.3684 5.8718 6.2564 6.7385 6.3807 6.5189 6.1277 5.4518 5.1213 5.0602 4.1136 4.1502 4.5485 3.8284 3.3306 3.1386 3.0404 2.8994 6.7769 6.3249 6.4663 6.4373 6.3153 6.1475 6.399 7.0334 7.4877 7.8529 7.823 7.9596 7.7713 7.2258 6.9064 6.6532 6.1539 6.1275 6.5288 6.1234 6.0898 5.1318 4.8382 4.3996 6.121 6.011 5.287 5.362 5.641 5.057 4.669 4.237 4.078 3.922 CPI Bonds Fauities A B D E F G 1 Quarters 2 Q3 1994 3 Q4 1994 4 Q1 1995 5 Q2 1995 6 Q3 1995 7 Q4 1995 8 Q1 1996 9 Q2 1996 10 Q3 1996 11 Q4 1996 12 Q1 1997 13 Q2 1997 14 Q3 1997 15 Q4 1997 16 01 1998 17 Q2 1998 18 Q3 1998 19 Q4 1998 20 Q1 1999 21 Q2 1999 22 Q3 1999 23 Q4 1999 24 01 2000 25 Q2 2000 26 Q3 2000 27 Q4 2000 28 Q1 2001 29 Q2 2001 30 Q3 2001 31 Q4 2001 32 01 2002 33 02 2002 34 Q3 2002 35 Q4 2002 36 Q1 2003 37 Q2 2003 38 Q3 2003 MSCI USA Large Cap 252.978 263 263.939 290.072 321.472 340.75 350.527 378.07 372.937 419.354 459.82 452.906 558.754 586.618 583.704 691.621 735.038 658.617 794.536 854.903 905.681 802.82 956.526 855.941 971.669 878.591 833.51 734.031 754.609 679.963 715.454 681.07 568.887 554.707 576.859 561.57 630.347 MSCI US SMALL CAP 422.981 442.453 435.305 466.868 523.559 544.149 544.476 605.768 581.988 656.11 692.035 641.662 782.194 888.237 818.595 959.421 920.745 674.864 858.358 846.127 970.101 865.546 1045.09 1026.54 1230.716 1092.719 1134.581 1047.721 1149.23 1018.958 1154.132 1217.715 980.404 902.012 985.065 945.485 1188.515 MSCI EM 578.578 698.678 598.165 524.125 578.478 574.79 567.009 602.312 627.491 604.764 601.205 652.124 707.935 644.449 531.555 564.472 431.27 336.357 396.86 446.214 555.079 526.472 660.407 676.402 607.647 528.654 487.785 433.772 422.132 368.05 454.683 503.513 466.153 381.254 443.86 423.943 517.347 MSCI EAFE 2243.683 2247.338 2225.946 2269.152 2287.429 2384.611 2483.068 2556.691 2599.028 2597.744 2641.011 2601.526 2941.159 2922.314 2695.362 3093.89 3128.846 2686.104 3243.415 3290.827 3376.725 3527.269 4128.811 4126.764 3965.721 3648.073 3489.793 3171.831 2949.05 2689.99 2722.69 2792.434 2550.848 2313.497 2416.911 2305.228 2652.767 MSCI USA (BM Only) 1119.778 1178.293 1182.011 1297.222 1425.372 1541.034 1633.386 1727.687 1811.811 1871.283 2026.293 2084.009 2455.442 2623.869 2716.982 3099.36 3206.355 2913.732 3551.723 3751.828 4001.631 3733.527 4346.659 4417.244 4261.432 4163.637 3804.815 3421.967 3545.214 3182.854 3348.623 3212.058 2674.843 2578.915 2704.175 2635.724 2980.102 CPI Bonds Equities + Ready A x fx . B Quarter Q3 1994 Q4 1994 Q1 1995 Q2 1995 Q3 1995 Q4 1995 Q1 1996 Q2 1996 Q3 1996 Q4 1996 Q1 1997 Q2 1997 Q3 1997 Q4 1997 Q1 1998 Q2 1998 Q3 1998 Q4 1998 Q1 1999 Q2 1999 Q3 1999 Q4 1999 Q1 2000 US CPI SADJ 148.9 149.767 150.867 152.1 152.867 153.7 155.067 156.4 157.3 158.667 159.633 160 160.8 161.667 162 162.533 163.367 164.133 164.733 165.967 167.2 168.433 170.1 CPI Bonds Equities + A B D U.S. Aggregate (BM Only) 7.28 U.S. Government 6.76 7.19 7.65 U.S. Corp. Invest. Grade 7.83 8.19 8.5 7.66 8.03 7.3 6.88 7.74 6.51 6.39 6.1 6.09 5.96 5.63 6.35 6.87 6.69 6.47 7.16 6.82 6.7 7.45 6.36 6.35 7.09 7.07 6.77 7.48 6.2 6.87 Quarters Q3 1994 Q4 1994 Q1 1995 Q2 1995 Q3 1995 Q4 1995 Q1 1996 Q2 1996 Q3 1996 Q4 1996 Q1 1997 Q2 1997 Q3 1997 Q4 1997 Q1 1998 Q2 1998 Q3 1998 Q4 1998 Q1 1999 Q2 1999 Q3 1999 Q4 1999 Q1 2000 Q2 2000 Q3 2000 04 2000 Q1 2001 Q2 2001 Q3 2001 Q4 2001 Q1 2002 Q2 2002 Q3 2002 Q4 2002 Q1 2003 Q2 2003 Q3 2003 7.12 6.8 6.77 7.16 6.58 6.486 5.977 6.158 6.106 5.604 5.674 5.958 6.524 6.915 7.323 7.11 7.244 6.937 6.354 6.1018 5.5274 5.7483 5.6565 4.7963 5.006 5.3684 5.8718 6.2564 6.7385 6.3807 6.5189 6.1277 5.4518 5.1213 5.0602 4.1136 4.1502 4.5485 3.8284 3.3306 3.1386 3.0404 2.8994 6.7769 6.3249 6.4663 6.4373 6.3153 6.1475 6.399 7.0334 7.4877 7.8529 7.823 7.9596 7.7713 7.2258 6.9064 6.6532 6.1539 6.1275 6.5288 6.1234 6.0898 5.1318 4.8382 4.3996 6.121 6.011 5.287 5.362 5.641 5.057 4.669 4.237 4.078 3.922 CPI Bonds Fauities A B D E F G 1 Quarters 2 Q3 1994 3 Q4 1994 4 Q1 1995 5 Q2 1995 6 Q3 1995 7 Q4 1995 8 Q1 1996 9 Q2 1996 10 Q3 1996 11 Q4 1996 12 Q1 1997 13 Q2 1997 14 Q3 1997 15 Q4 1997 16 01 1998 17 Q2 1998 18 Q3 1998 19 Q4 1998 20 Q1 1999 21 Q2 1999 22 Q3 1999 23 Q4 1999 24 01 2000 25 Q2 2000 26 Q3 2000 27 Q4 2000 28 Q1 2001 29 Q2 2001 30 Q3 2001 31 Q4 2001 32 01 2002 33 02 2002 34 Q3 2002 35 Q4 2002 36 Q1 2003 37 Q2 2003 38 Q3 2003 MSCI USA Large Cap 252.978 263 263.939 290.072 321.472 340.75 350.527 378.07 372.937 419.354 459.82 452.906 558.754 586.618 583.704 691.621 735.038 658.617 794.536 854.903 905.681 802.82 956.526 855.941 971.669 878.591 833.51 734.031 754.609 679.963 715.454 681.07 568.887 554.707 576.859 561.57 630.347 MSCI US SMALL CAP 422.981 442.453 435.305 466.868 523.559 544.149 544.476 605.768 581.988 656.11 692.035 641.662 782.194 888.237 818.595 959.421 920.745 674.864 858.358 846.127 970.101 865.546 1045.09 1026.54 1230.716 1092.719 1134.581 1047.721 1149.23 1018.958 1154.132 1217.715 980.404 902.012 985.065 945.485 1188.515 MSCI EM 578.578 698.678 598.165 524.125 578.478 574.79 567.009 602.312 627.491 604.764 601.205 652.124 707.935 644.449 531.555 564.472 431.27 336.357 396.86 446.214 555.079 526.472 660.407 676.402 607.647 528.654 487.785 433.772 422.132 368.05 454.683 503.513 466.153 381.254 443.86 423.943 517.347 MSCI EAFE 2243.683 2247.338 2225.946 2269.152 2287.429 2384.611 2483.068 2556.691 2599.028 2597.744 2641.011 2601.526 2941.159 2922.314 2695.362 3093.89 3128.846 2686.104 3243.415 3290.827 3376.725 3527.269 4128.811 4126.764 3965.721 3648.073 3489.793 3171.831 2949.05 2689.99 2722.69 2792.434 2550.848 2313.497 2416.911 2305.228 2652.767 MSCI USA (BM Only) 1119.778 1178.293 1182.011 1297.222 1425.372 1541.034 1633.386 1727.687 1811.811 1871.283 2026.293 2084.009 2455.442 2623.869 2716.982 3099.36 3206.355 2913.732 3551.723 3751.828 4001.631 3733.527 4346.659 4417.244 4261.432 4163.637 3804.815 3421.967 3545.214 3182.854 3348.623 3212.058 2674.843 2578.915 2704.175 2635.724 2980.102 CPI Bonds Equities + Ready
Step by Step Solution
There are 3 Steps involved in it
Step: 1

Get Instant Access to Expert-Tailored Solutions
See step-by-step solutions with expert insights and AI powered tools for academic success
Step: 2

Step: 3

Ace Your Homework with AI
Get the answers you need in no time with our AI-driven, step-by-step assistance
Get Started


