

Question
Annual balance sheet item Open help content 2018 1/27/18 2019 2/2/19 2020 2/1/20 2021 1/30/21 Cash and Short Term Inv 55 50 90 439 Total
|
Open help content | 2018 1/27/18 | 2019 2/2/19 | 2020 2/1/20 | 2021 1/30/21 |
| Cash and Short Term Inv | 55 | 50 | 90 | 439 |
| Total Receivables, Net | 12 | 36 | 35 | 21 |
| Total Inventory | 491 | 581 | 623 | 631 |
| Prepaid Expenses | 7 | 16 | 12 | 10 |
| Other Curr. Assets, Total | 0 | 6 | 4 | 0 |
| Total Current Assets | 565 | 689 | 764 | 1,100 |
| Buildings | -- | 424 | 495 | 541 |
| Land/Improvements | -- | 65 | 70 | 70 |
| Machinery/Equipment | -- | 492 | 562 | 638 |
| Construction in Progress | -- | 30 | 0 | 0 |
| Other Prop./Plant/Equip. | 1,142 | 1,208 | 1,284 | 1,345 |
| Prop./Plant/Equip. - Gross | 1,142 | 2,218 | 2,411 | 2,594 |
| Accumulated Depreciation | -- | -424 | -484 | -540 |
| Prop./Plant/Equip. - Net | 1,633 | 1,794 | 1,928 | 2,054 |
| Goodwill, Gross | -- | 728 | 728 | 728 |
| Accum. Goodwill Amort. | -- | 0 | 0 | 0 |
| Goodwill, Net | 728 | 728 | 728 | 728 |
| Intangibles, Gross | -- | 211 | 231 | 258 |
| Accum. Intangible Amort. | -- | -62 | -78 | -97 |
| Intangible, Net | 143 | 149 | 153 | 162 |
| Long Term Investments | -- | -- | 143 | 179 |
| Other Long Term Assets | -- | -- | -- | 0 |
| Total Assets | 3,069 | 3,360 | 3,716 | 4,224 |
| Accounts Payable | -- | 80 | 65 | 67 |
| Payable/Accrued | 227 | -- | -- | -- |
| Accrued Expenses | -- | 79 | 91 | 96 |
| Notes Payable/ST Debt | 0 | 0 | 0 | 0 |
| Curr. Port. LT Dbt/Cap Ls. | 546 | 164 | 789 | 1,015 |
| Dividends Payable | 12 | 13 | 14 | 15 |
| Income Taxes Payable | 36 | 35 | 0 | 13 |
| Other Payables | -- | 72 | 133 | 90 |
| Other Current Liabilities | 39 | 1 | 0 | 26 |
| Other Curr. Lblts, Total | 87 | 120 | 147 | 143 |
| Total Current Liabilities | 861 | 443 | 1,092 | 1,321 |
| Long Term Debt | 1,260 | 1,891 | 1,270 | 1,044 |
| Capital Lease Obligations | 1,196 | 1,246 | 1,332 | 1,402 |
| Total Long Term Debt | 2,457 | 3,137 | 2,602 | 2,446 |
| Total Debt | 3,003 | 3,301 | 3,392 | 3,461 |
| Deferred Income Tax | 83 | 97 | 114 | 122 |
| Total Liabilities | 3,401 | 3,677 | 3,809 | 3,889 |
| Common Stock | 416 | 408 | 449 | 485 |
| Additional Paid-In Capital | 28 | 32 | 29 | 29 |
| Ret. Earn.(Accum. Deficit) | -743 | -765 | -574 | -150 |
| Other Equity, Total | -32 | 7 | 4 | -29 |
| Total Equity | -332 | -317 | -92 | 335 |
| Total Liabilities & Shareholders' Equity | 3,069 | 3,360 | 3,716 | 4,224 |
 Annual balance sheet item
Required
1. Calculate the following ratios for the period 2018-2021 and comment on how Covid-19 has affected this Firm. In your analysis explain strategies that Dollarama can use to recover fully.
A) Current Ratio
B) Total Debt ratio
C) Inventory Turnover and Days sales in Inventory
D) Receivable Turnover and Days sales in Receivable Turnover
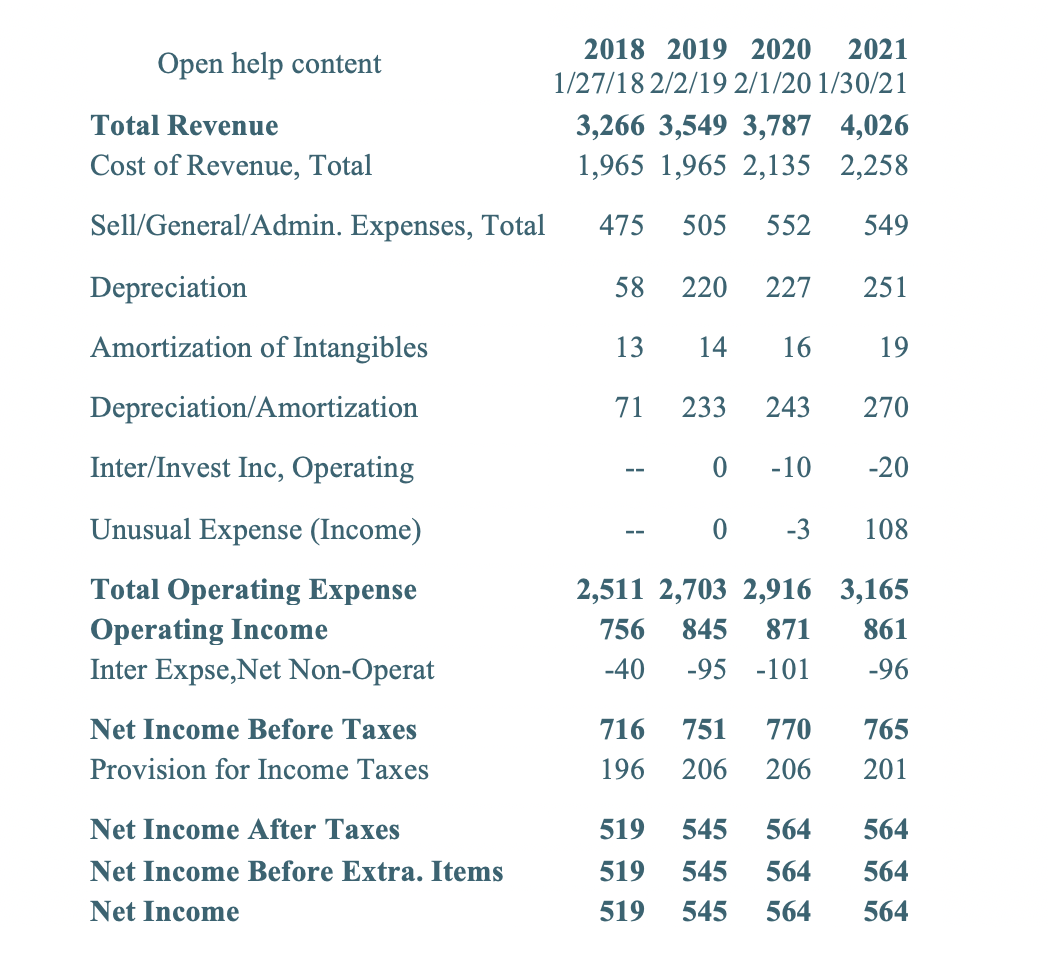
Open help content 2018 2019 2020 2021 1/27/18 2/2/19 2/1/20 1/30/21 3,266 3,549 3,787 4,026 1,965 1,965 2,135 2,258 Total Revenue Cost of Revenue, Total Sell/ General/Admin. Expenses, Total 475 505 552 549 Depreciation 58 220 227 251 Amortization of Intangibles 13 14 16 19 Depreciation/Amortization 71 233 243 270 Inter/Invest Inc, Operating 0 -10 -20 Unusual Expense (Income) 0 -3 108 Total Operating Expense Operating Income Inter Expse,Net Non-Operat 2,511 2,703 2,916 3,165 756 845 871 861 -40 -95 -101 -96 716 751 Net Income Before Taxes Provision for Income Taxes 770 206 765 201 196 206 Net Income After Taxes Net Income Before Extra. Items Net Income 519 519 519 545 545 545 564 564 564 564 564 564
Step by Step Solution
There are 3 Steps involved in it
Step: 1

Get Instant Access to Expert-Tailored Solutions
See step-by-step solutions with expert insights and AI powered tools for academic success
Step: 2

Step: 3
Ace Your Homework with AI
Get the answers you need in no time with our AI-driven, step-by-step assistance
Get Started
Financial Regulation In The Global Economy
Authors: Richard J. Herring , Robert E. Litan
1st Edition