Answered step by step
Verified Expert Solution
Question
1 Approved Answer
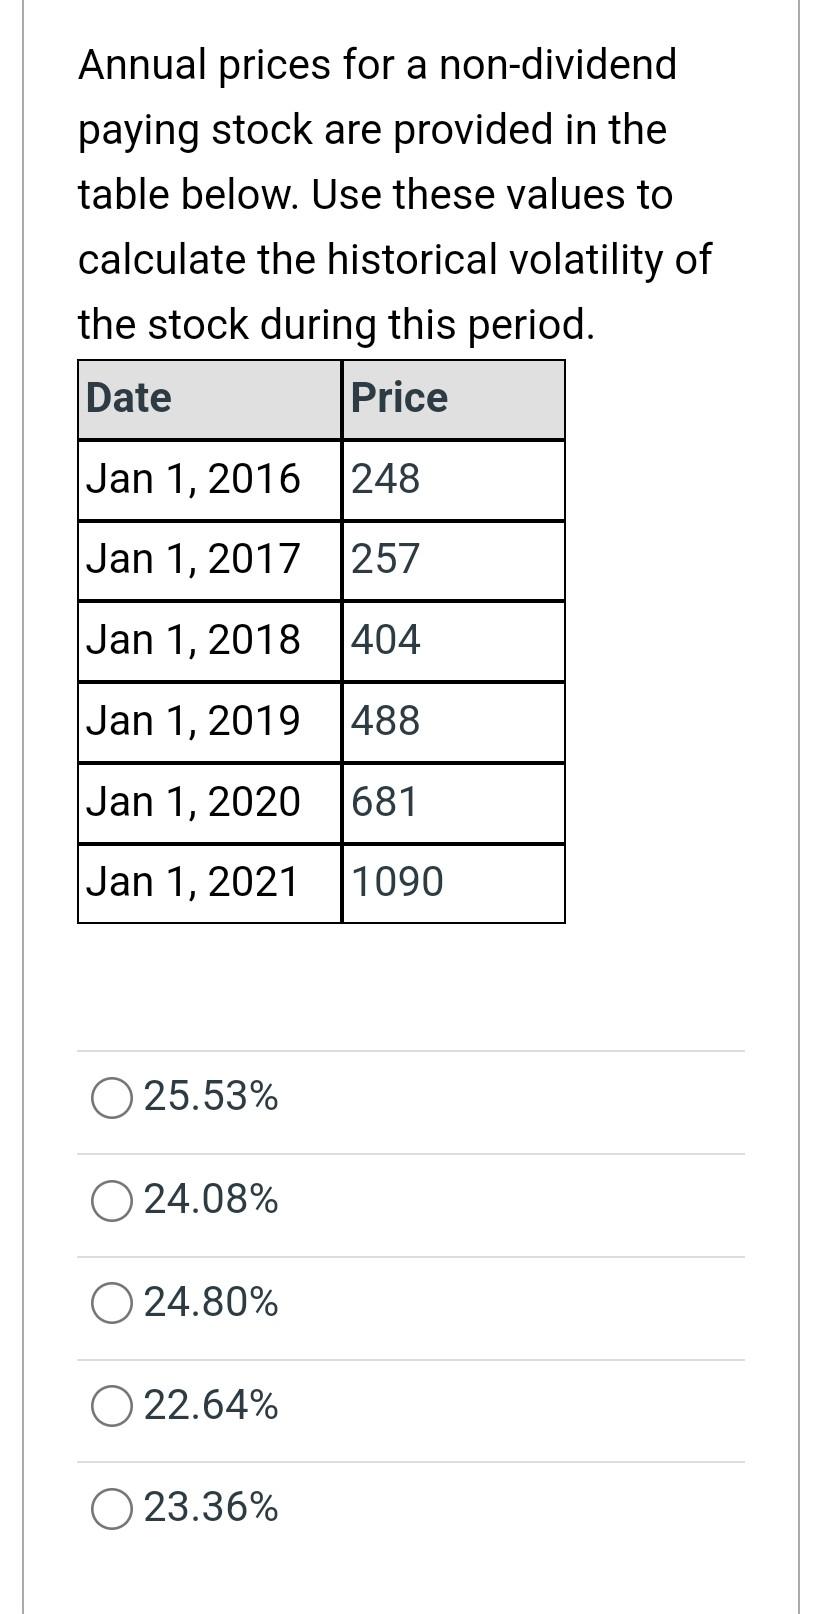
Annual prices for a non-dividend paying stock are provided in the table below. Use these values to calculate the historical volatility of the stock during

Annual prices for a non-dividend paying stock are provided in the table below. Use these values to calculate the historical volatility of the stock during this period. Date Price Jan 1, 2016 248 Jan 1, 2017 257 Jan 1, 2018 404 Jan 1, 2019 488 Jan 1, 2020 681 Jan 1, 2021 1090 0 25.53% O24.08% 0 24.80% O 22.64% O23.36%
Step by Step Solution
There are 3 Steps involved in it
Step: 1

Get Instant Access to Expert-Tailored Solutions
See step-by-step solutions with expert insights and AI powered tools for academic success
Step: 2

Step: 3

Ace Your Homework with AI
Get the answers you need in no time with our AI-driven, step-by-step assistance
Get Started


