Answered step by step
Verified Expert Solution
Question
1 Approved Answer
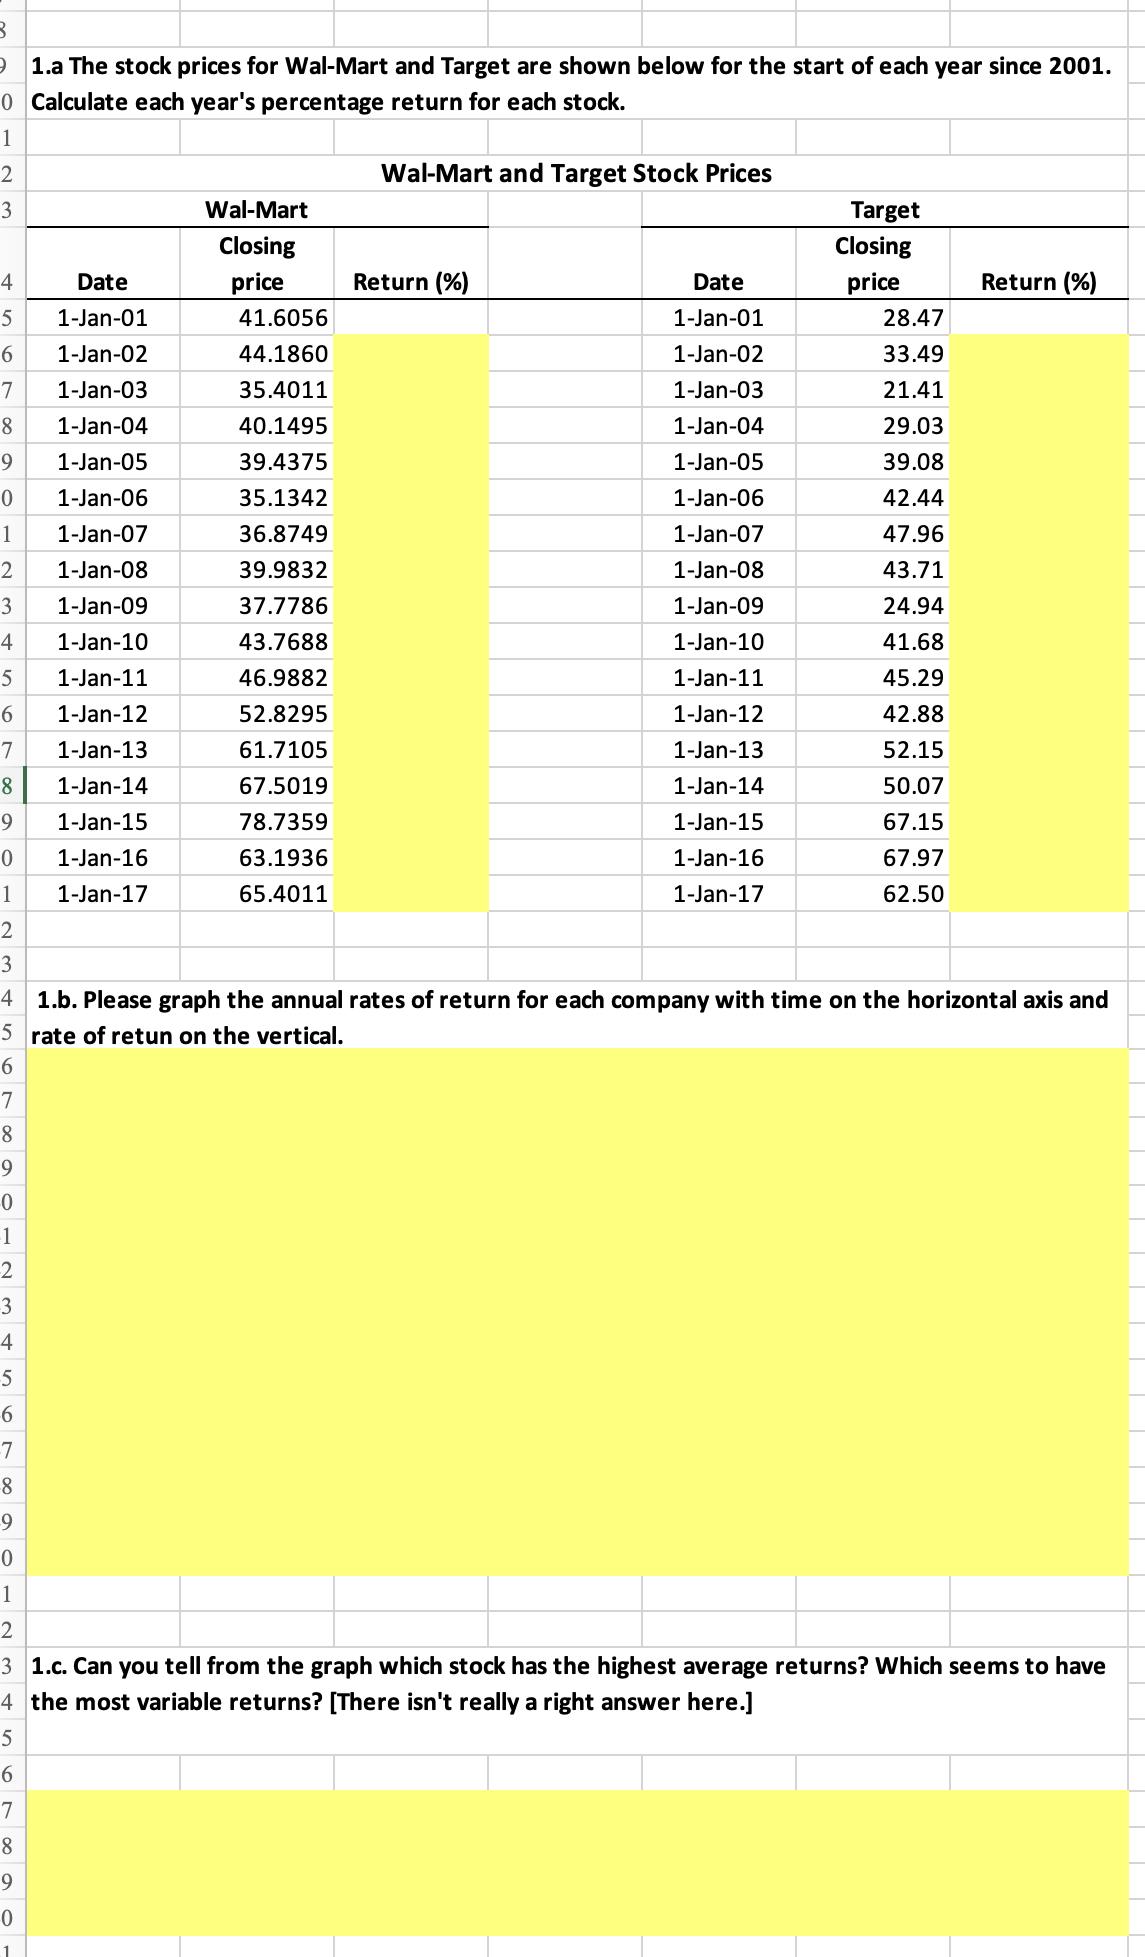
Answer all of the yellow and explain how/why. 3. 9 1.a The stock prices for Wal-Mart and Target are shown below for the start of


Answer all of the yellow and explain how/why.
3. 9 1.a The stock prices for Wal-Mart and Target are shown below for the start of each year since 2001. 0 Calculate each year's percentage return for each stock. 1 2 3 Wal-Mart and Target Stock Prices Wal-Mart Closing Target Closing 4 Date price Return (%) Date price Return (%) 5 1-Jan-01 41.6056 1-Jan-01 28.47 6 1-Jan-02 44.1860 1-Jan-02 33.49 7 1-Jan-03 35.4011 1-Jan-03 21.41 8 1-Jan-04 40.1495 1-Jan-04 29.03 9 1-Jan-05 39.4375 1-Jan-05 39.08 0 1-Jan-06 35.1342 1-Jan-06 42.44 1 1-Jan-07 36.8749 1-Jan-07 47.96 2 1-Jan-08 39.9832 1-Jan-08 43.71 3 1-Jan-09 37.7786 1-Jan-09 24.94 4 1-Jan-10 43.7688 1-Jan-10 41.68 5 1-Jan-11 46.9882 1-Jan-11 45.29 6 1-Jan-12 52.8295 1-Jan-12 42.88 7 1-Jan-13 61.7105 1-Jan-13 52.15 8 1-Jan-14 67.5019 1-Jan-14 50.07 9 1-Jan-15 78.7359 1-Jan-15 67.15 0 1-Jan-16 63.1936 1-Jan-16 67.97 1 1-Jan-17 65.4011 1-Jan-17 62.50 2 3 4 1.b. Please graph the annual rates of return for each company with time on the horizontal axis and 5 rate of retun on the vertical. 6 7 8 9 0 1 2 3 4 5 6 7 8 9 0 1 2 3 1.c. Can you tell from the graph which stock has the highest average returns? Which seems to have 4 the most variable returns? [There isn't really a right answer here.] 5 6 7 8 9 0 1
Step by Step Solution
There are 3 Steps involved in it
Step: 1

Get Instant Access to Expert-Tailored Solutions
See step-by-step solutions with expert insights and AI powered tools for academic success
Step: 2

Step: 3

Ace Your Homework with AI
Get the answers you need in no time with our AI-driven, step-by-step assistance
Get Started


