Answered step by step
Verified Expert Solution
Question
1 Approved Answer
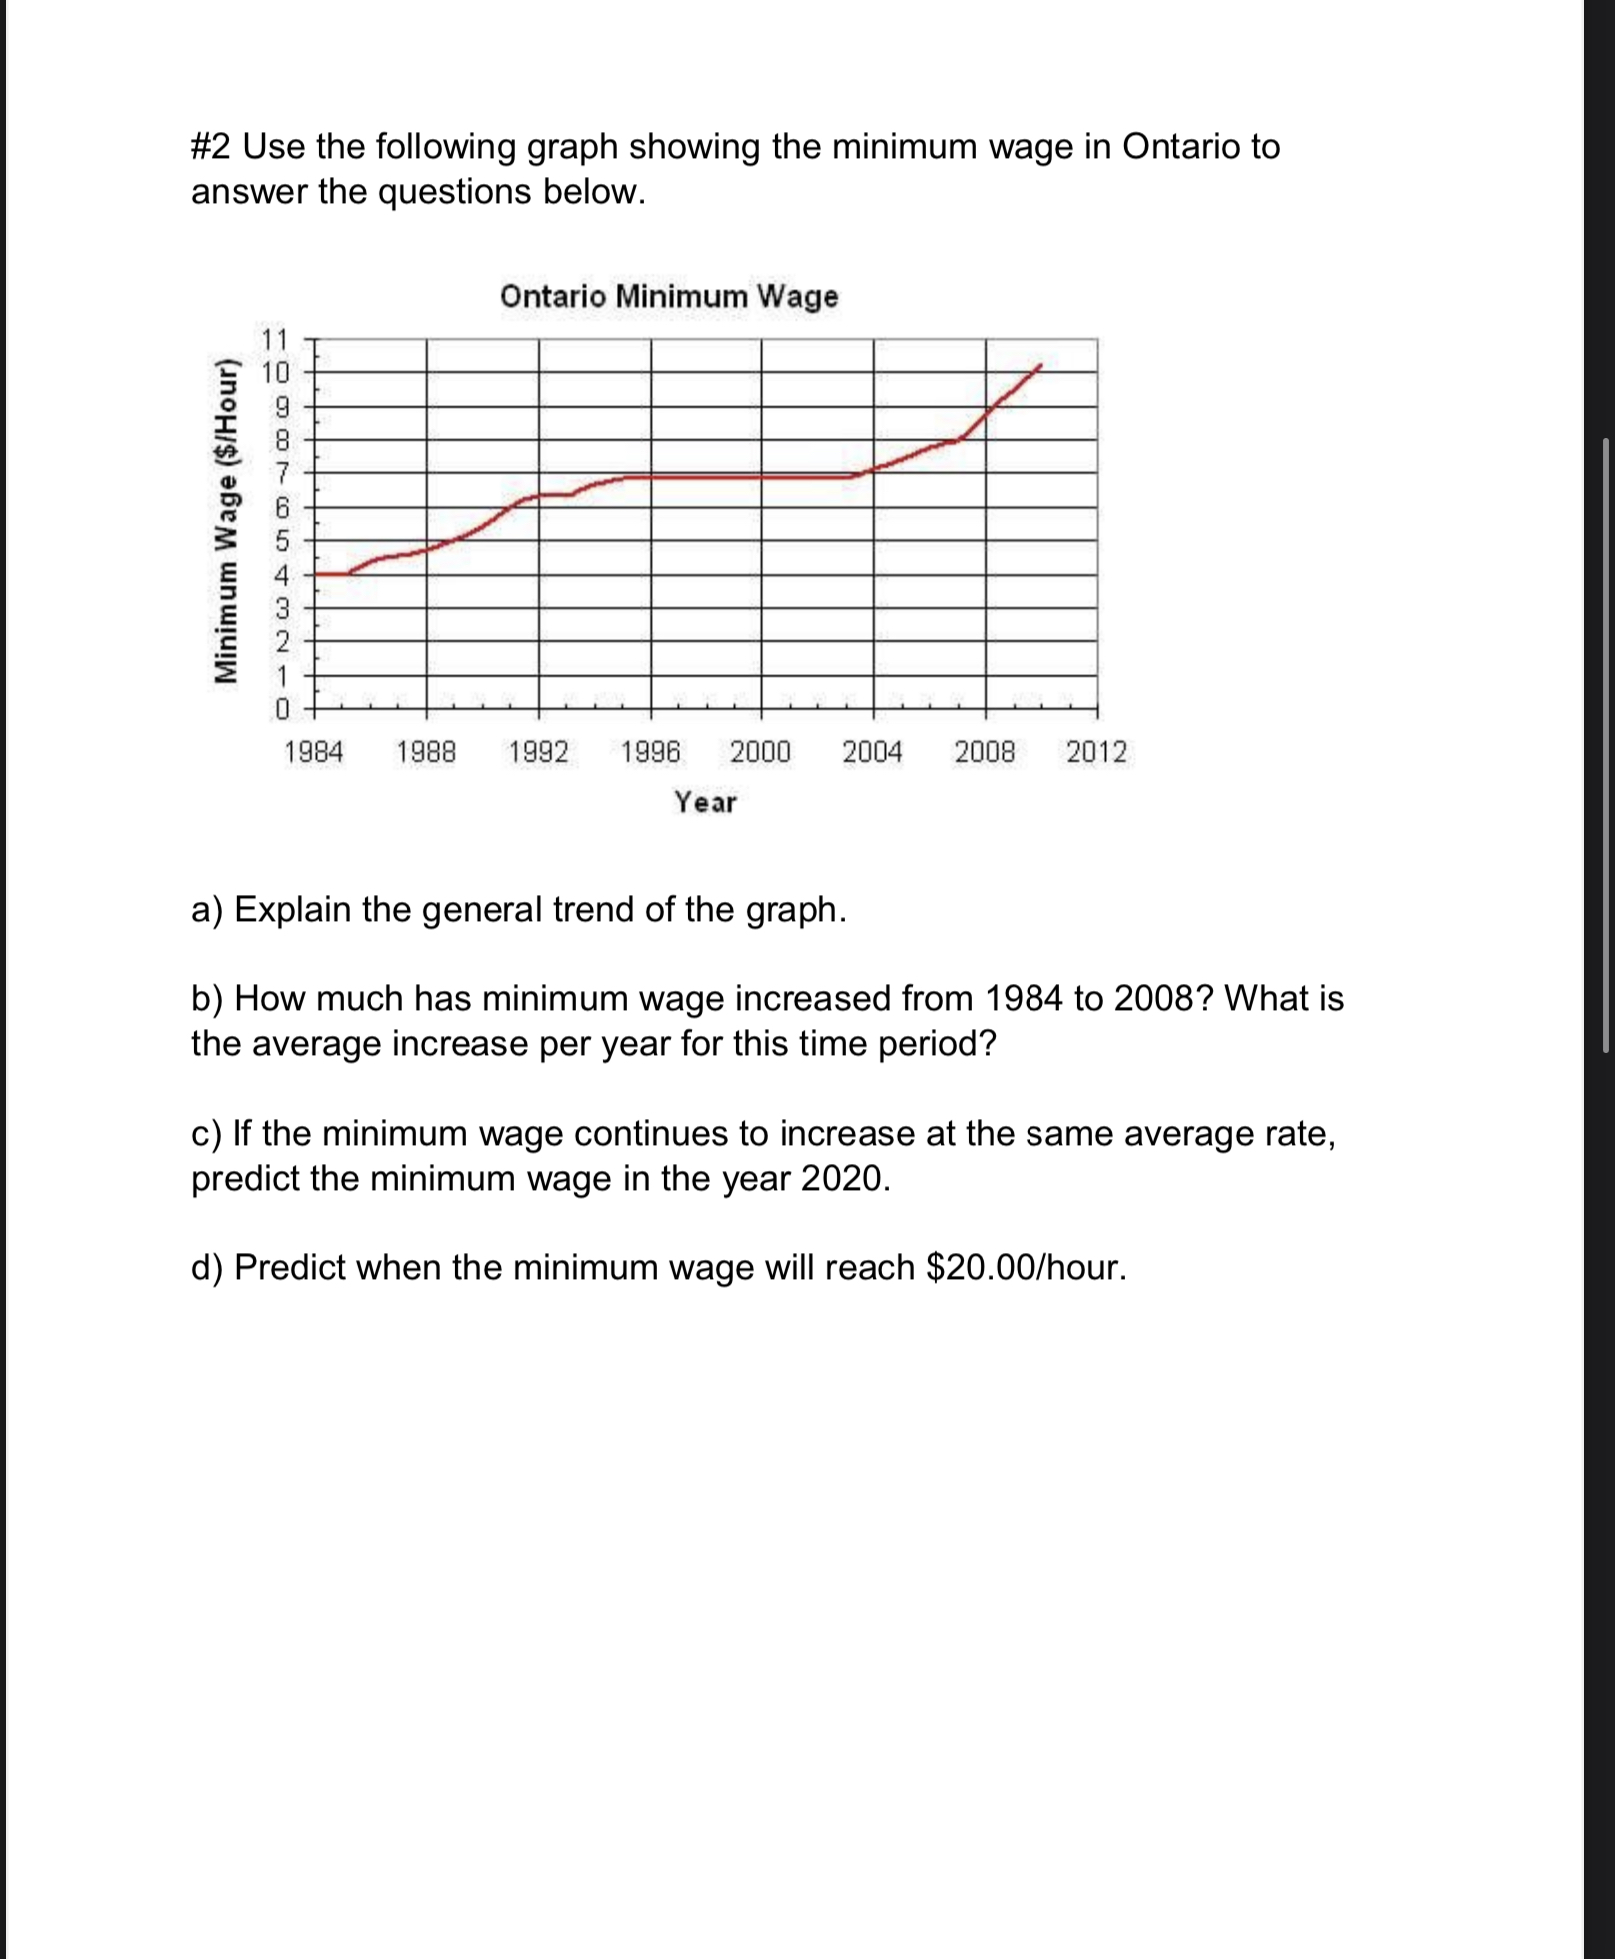
#2 Use the following graph showing the minimum wage in Ontario to answer the questions below. Ontario Minimum Wage Minimum Wage ($/Hour) 10 CG8F65432


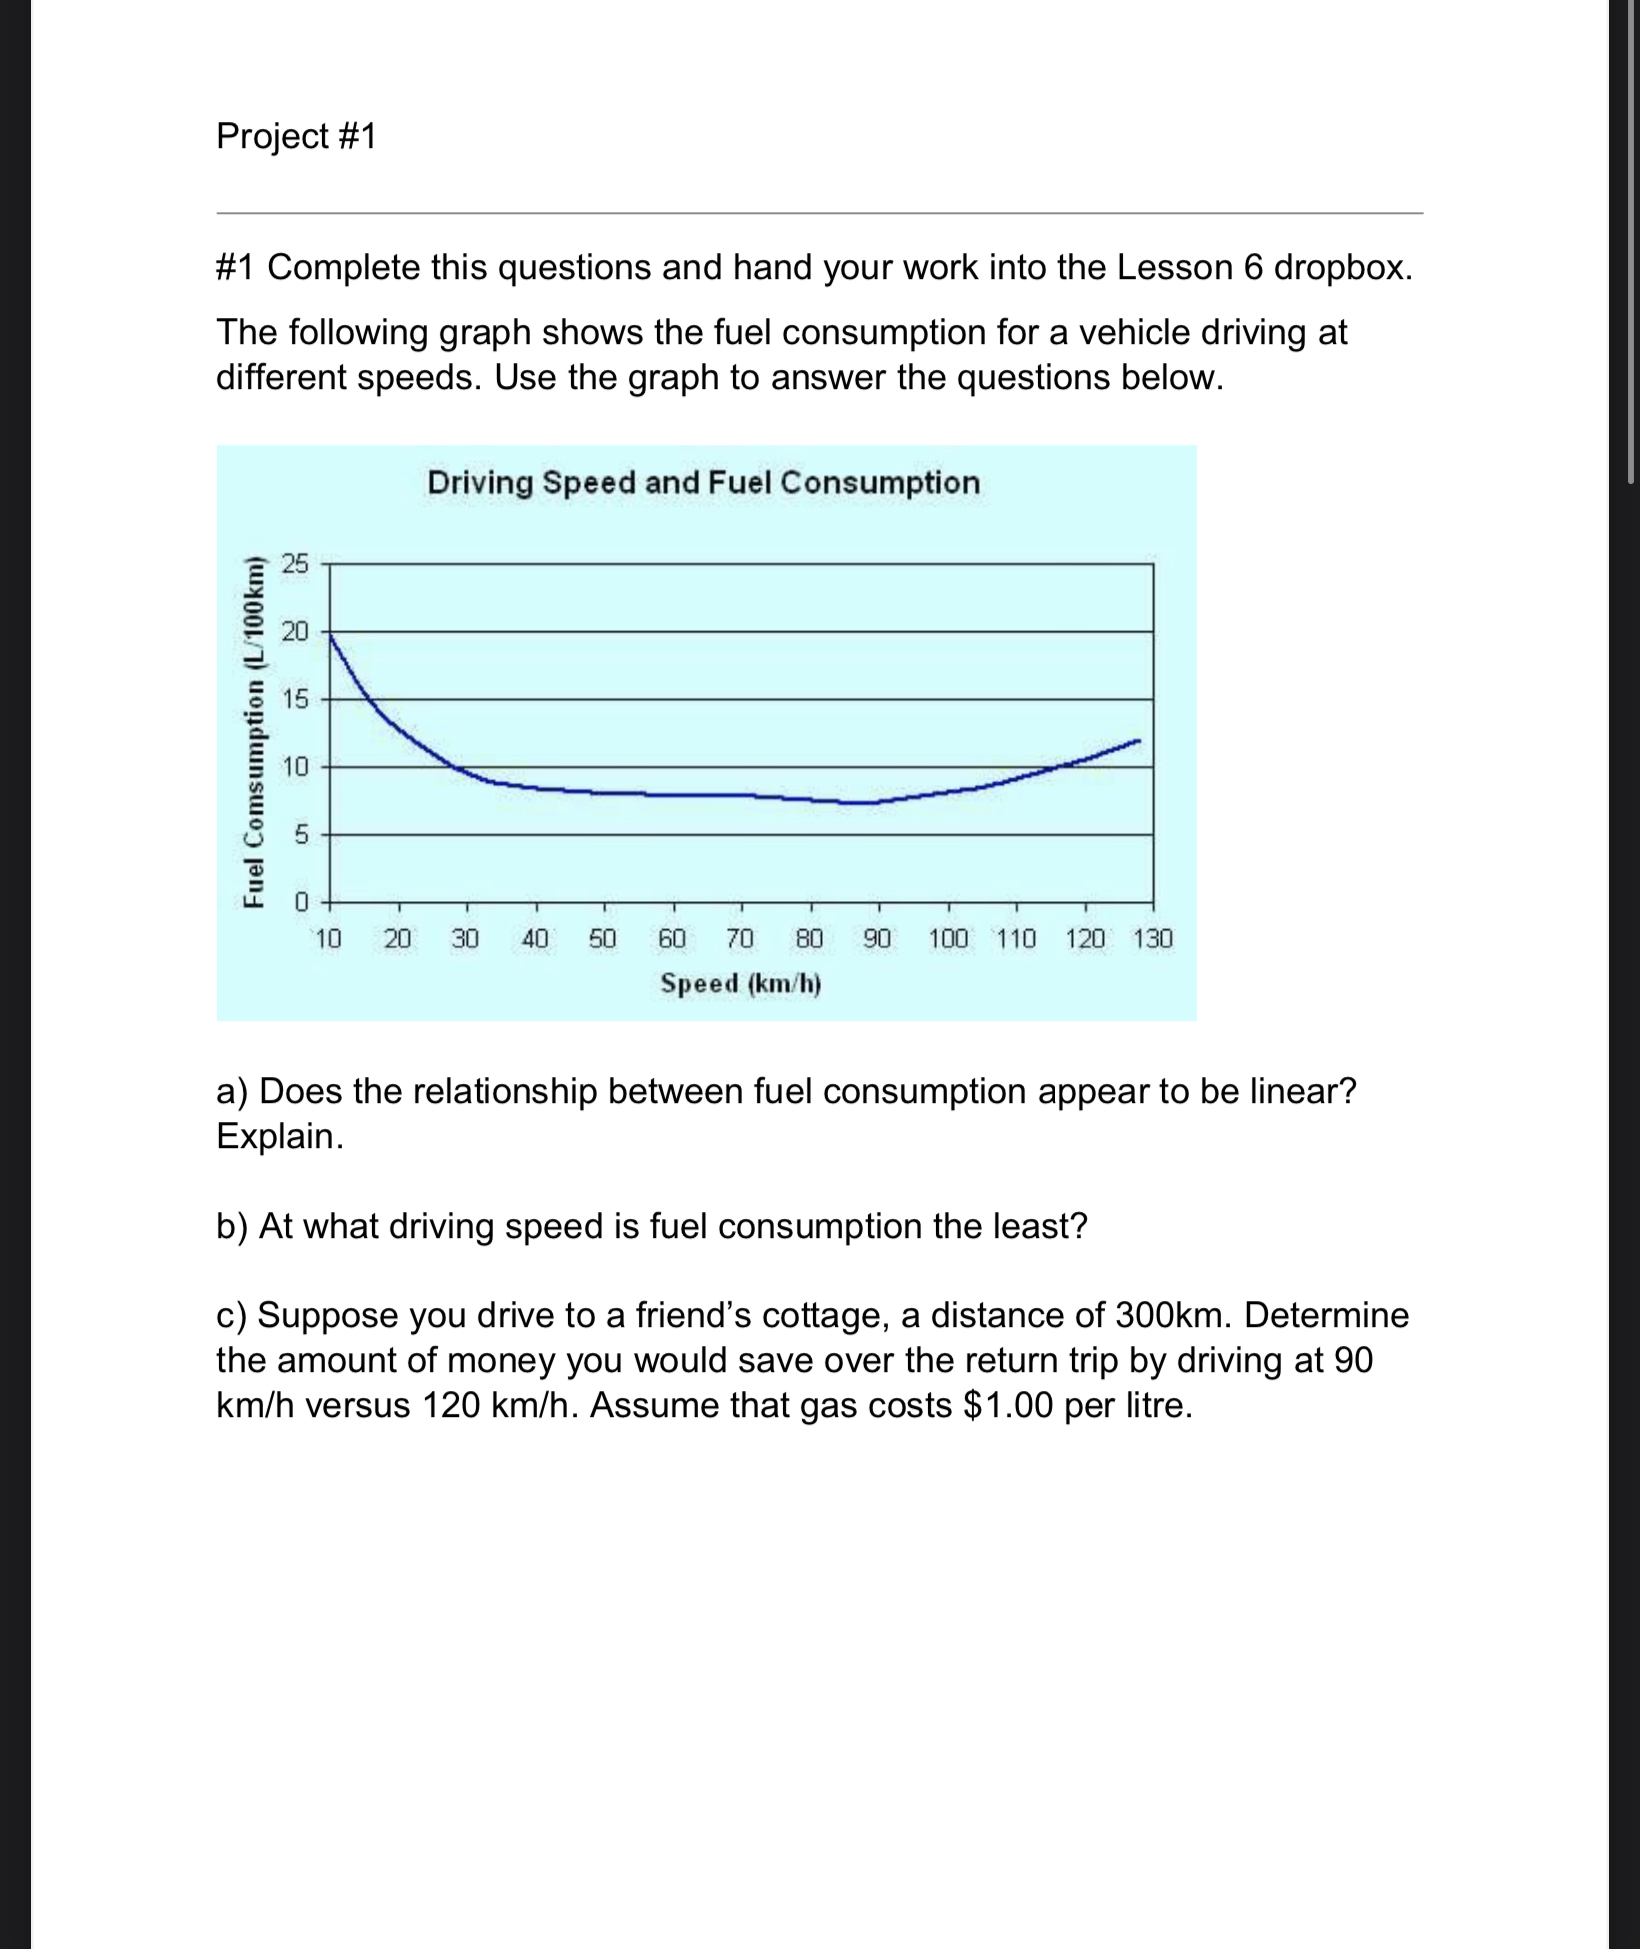
#2 Use the following graph showing the minimum wage in Ontario to answer the questions below. Ontario Minimum Wage Minimum Wage ($/Hour) 10 CG8F65432 0 1984 1988 1992 1996 2000 2004 2008 2012 Year a) Explain the general trend of the graph. b) How much has minimum wage increased from 1984 to 2008? What is the average increase per year for this time period? c) If the minimum wage continues to increase at the same average rate, predict the minimum wage in the year 2020. d) Predict when the minimum wage will reach $20.00/hour. Project #1 #1 Complete this questions and hand your work into the Lesson 6 dropbox. The following graph shows the fuel consumption for a vehicle driving at different speeds. Use the graph to answer the questions below. Driving Speed and Fuel Consumption 25 20 15 10 Fuel Comsumption (L/100km) 0 10 20 30 40 50 60 70 80 90 Speed (km/h) 100 110 120 130 a) Does the relationship between fuel consumption appear to be linear? Explain. b) At what driving speed is fuel consumption the least? c) Suppose you drive to a friend's cottage, a distance of 300km. Determine the amount of money you would save over the return trip by driving at 90 km/h versus 120 km/h. Assume that gas costs $1.00 per litre.
Step by Step Solution
There are 3 Steps involved in it
Step: 1

Get Instant Access to Expert-Tailored Solutions
See step-by-step solutions with expert insights and AI powered tools for academic success
Step: 2

Step: 3

Ace Your Homework with AI
Get the answers you need in no time with our AI-driven, step-by-step assistance
Get Started


