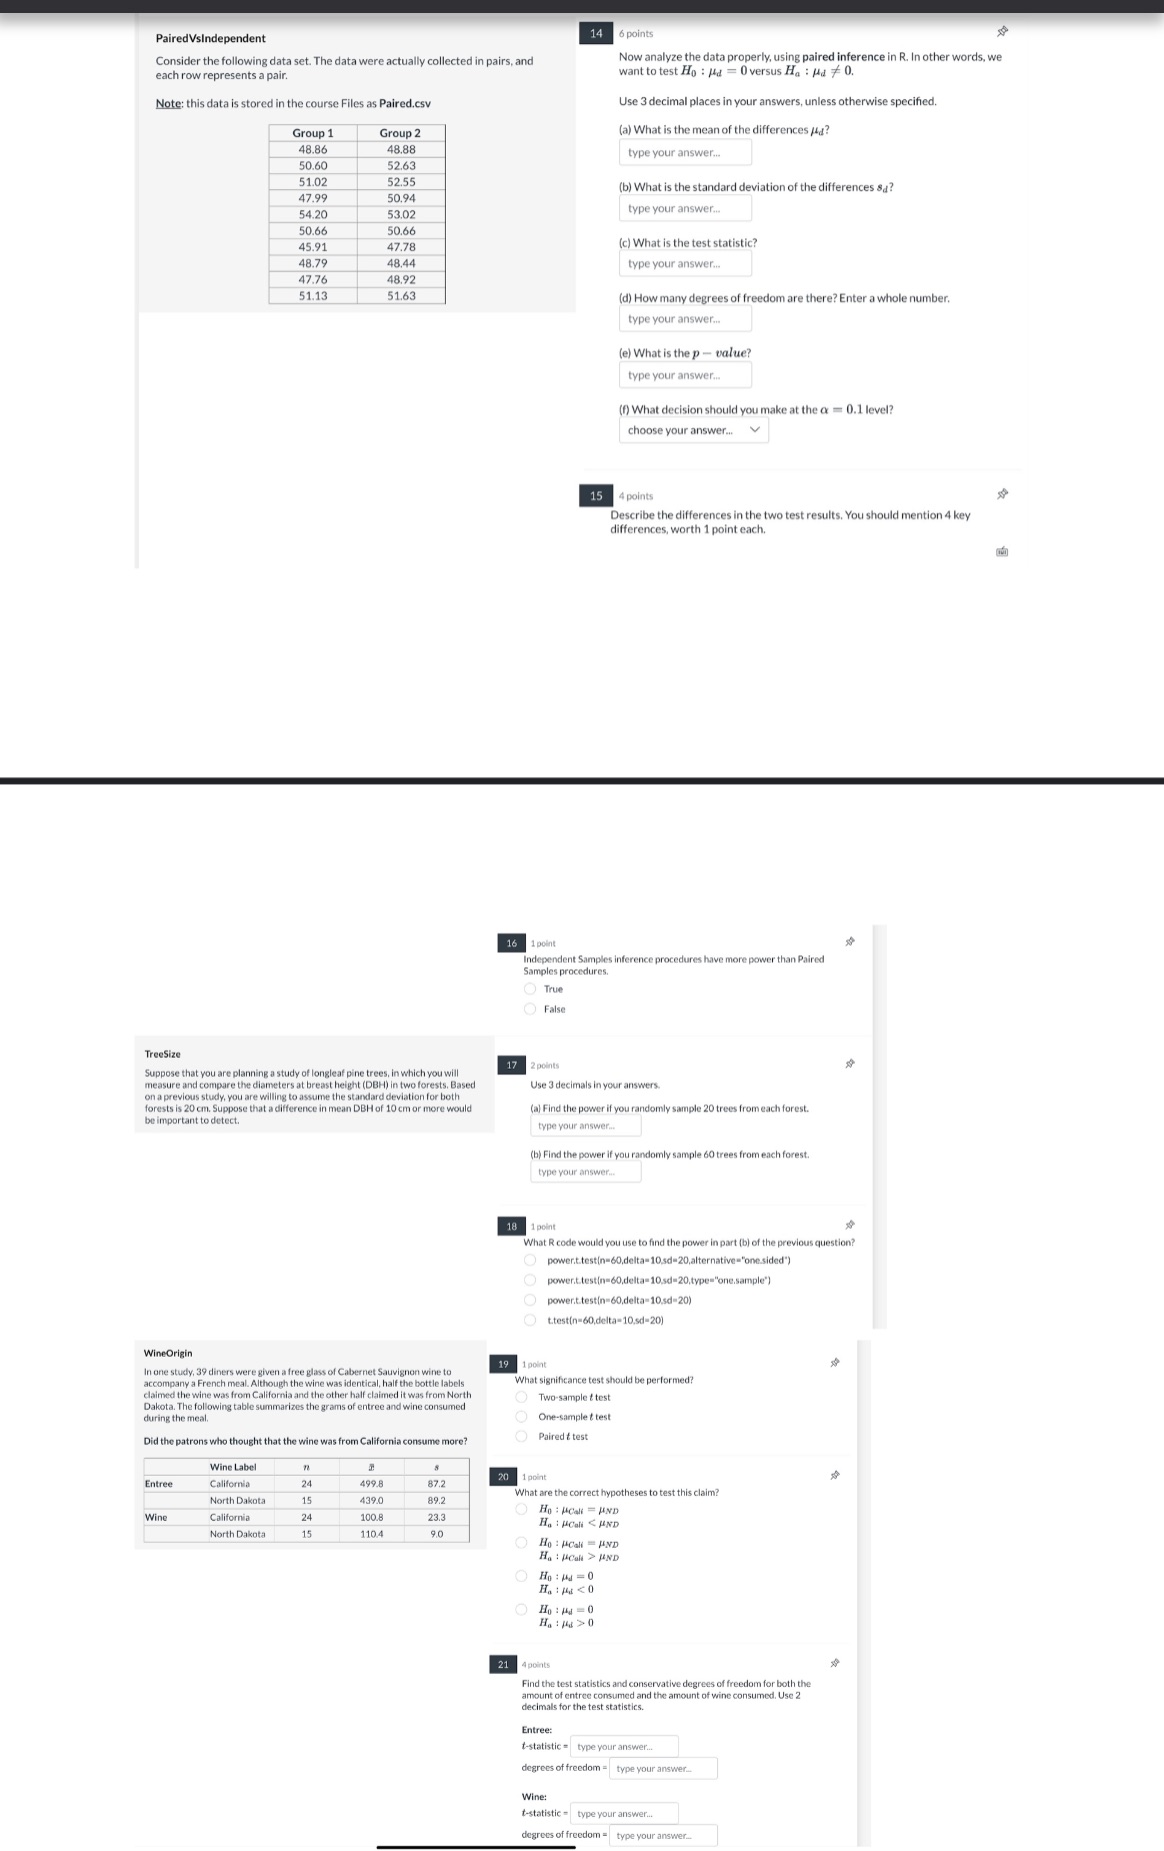
Answer all parts from question 14-21
PairedVsIndependent 14 6 points Consider the following data set. The data were actually collected in pairs, and Now analyze the data properly, using paired inference in R. In other words, we each row represents a pair. want to test Ho : Mid = 0 versus Ha : Ha * 0. Note: this data is stored in the course Files as Paired.csv Use 3 decimal places in your answers, unless otherwise specified. Group 1 Group 2 (a) What is the mean of the differences /4? 48.86 48.88 type your answer.. 50.60 52.63 51.02 52.55 b) What is the standard deviation of the differences sa? 47.99 50.94 54.20 53.02 type your answer.. 50.66 50.66 45.91 47.78 (c) What is the test statistic? 48.79 48.44 type your answer... 47.76 48.92 51.13 51.63 d) How many degrees of freedom are there? Enter a whole number. type your answer... (e) What is the p - value? type your answer.. (f) What decision should you make at the or = 0.1 level? choose your answer... 15 4 points Describe the differences in the two test results. You should mention 4 key differences, worth 1 point each. 16 1 point Independent Samples inference procedures have more power than Paired Samples procedures. True False TreeSize Suppose that you are planning a study of longleaf pine trees, in which you will 17 2 points measure and compare the diameters at breast height (DBH) in two forests, Based Use 3 decimals in your answers. on a previous study, you are willing to assume the standard deviation for both forests is 20 cm. Suppose that a difference in mean DBH of 10 cm or more would (a) Find the power if you randomly sample 20 trees from each forest. be important to detect. type your answ (b) Find the power if you randomly sample 60 trees from each forest. type your answer. 18 1 point What R code would you use to find the power in part (b) of the previous question? O power.t.test(n=60,delta=10.sd=20,altern "one.sided") power.t.test(n=60.delta=10.sd=20,type="one.sample") power.t.test(n=60,delta=10.sd=20 t.test(n=60,delta=10,sd-20) WineOrigin 9 1 point In one study, 39 diners were given a free glass of Cabernet Sauvignon wine to though the wine was identical, half the bottle labels What significance test should be performed? ned the wine was from California and the other half claimed it was from North Dakota. The following table summarizes the grams of entree and wine consumed Two-sample & test during the meal. One-sample t test Did the patrons who thought that the wine was from California consume more? Paired & test Wine Label 1 point Entree California 499.8 87.2 North Dakota 439.0 89.2 What are the correct hypotheses to test this claim? Wine California 100 8 23.3 Ho : UCall = UND North Dakota 1104 90 He : HCali UND Ho : PCall = UND Ha : PCall > UND O Ho : 14 = 0 O Ho : 144 = 0 Ha : pi >0 21 4 points Find the test statistics and conservative degrees of freedom for both the mount of entree consumed and the amount of wine consumed. Use 2 decimals for the test statistics. Entree: t-statistic = type your answer. degrees of freedom = type your answer. Wine: t-statistic = type your answer. degrees of freedom = ype your


