

Question: Answer all questions and calculations please! Lab 19: External Forces and the 3rd Law Force Sensor String Elastic Cord PASCOL PASCO Figure 1. The two
Answer all questions and calculations please!
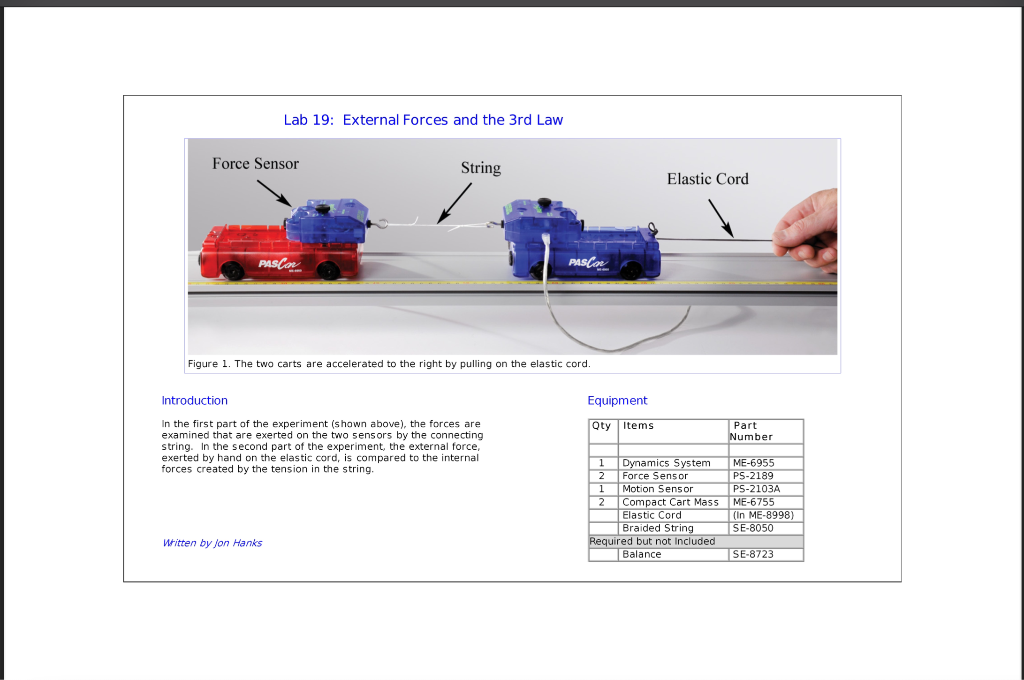
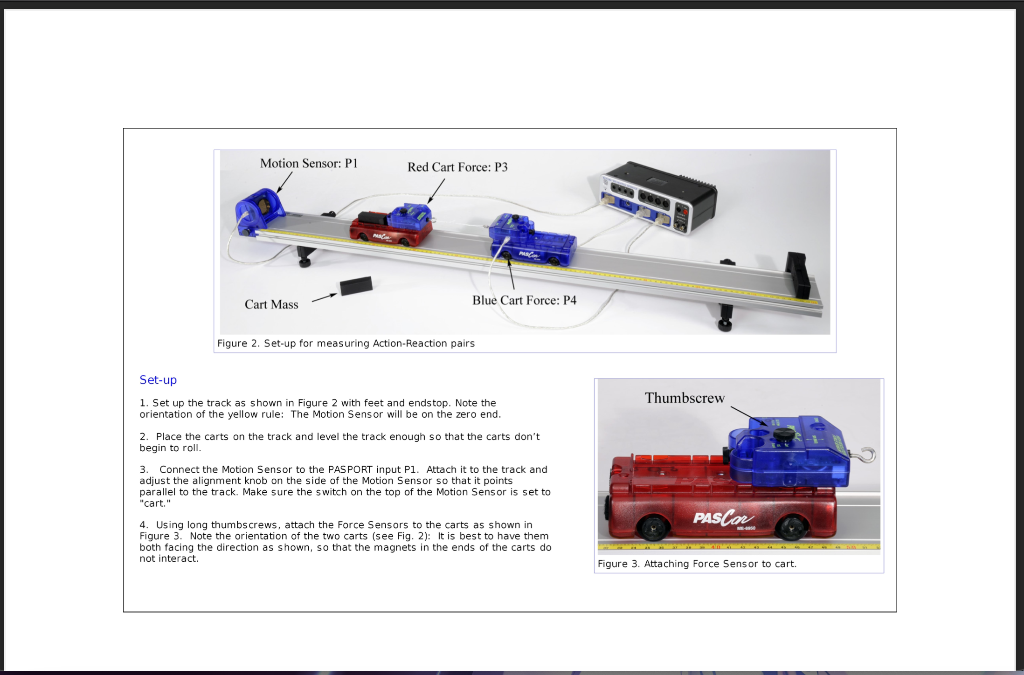
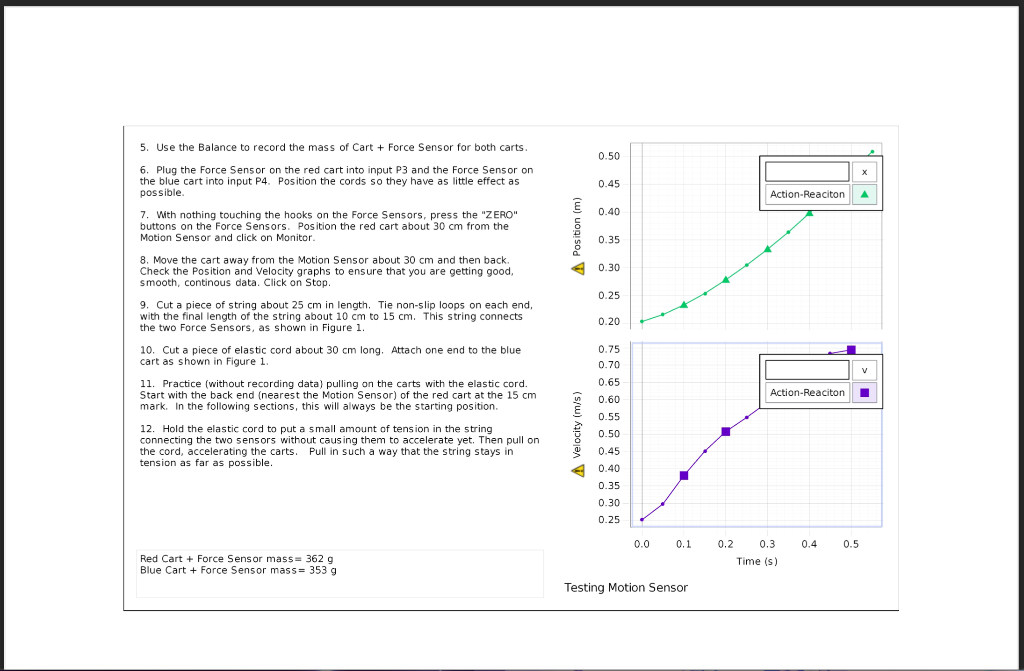
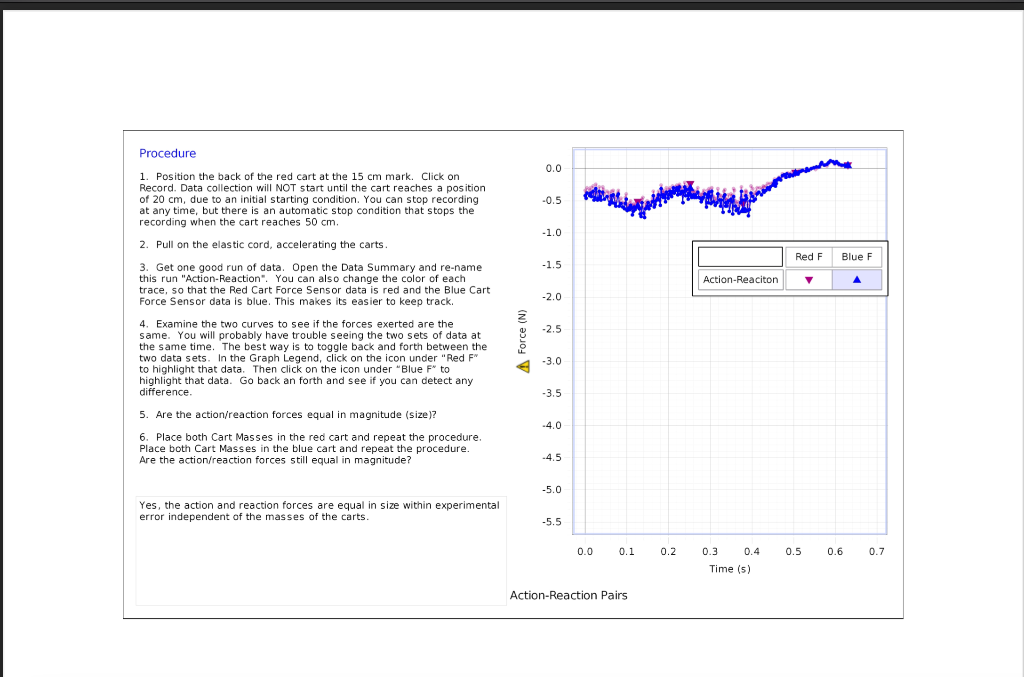
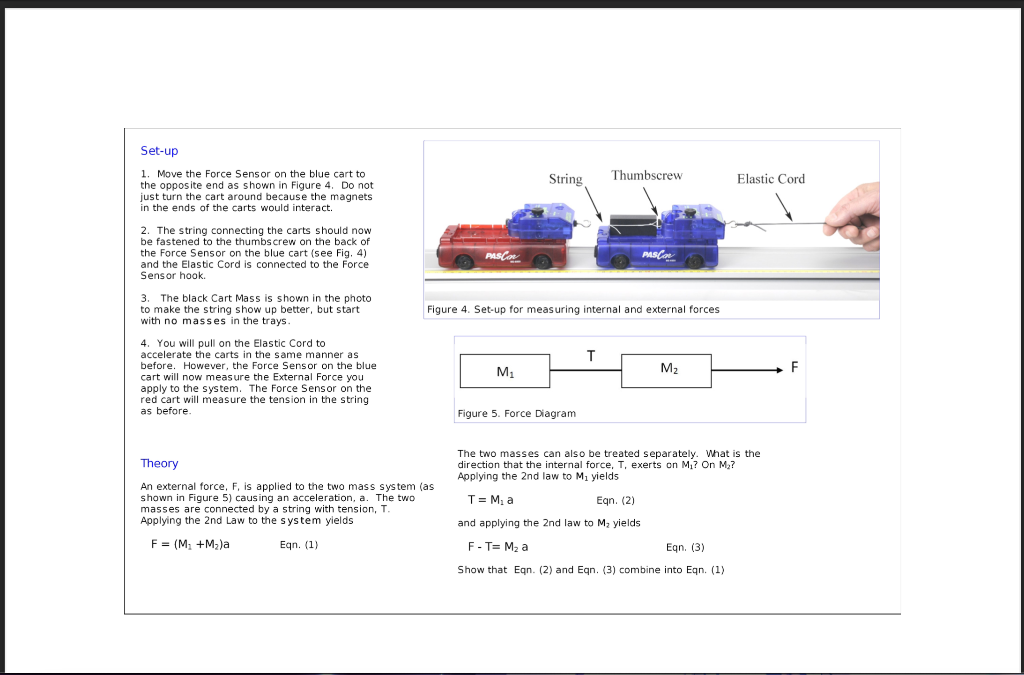
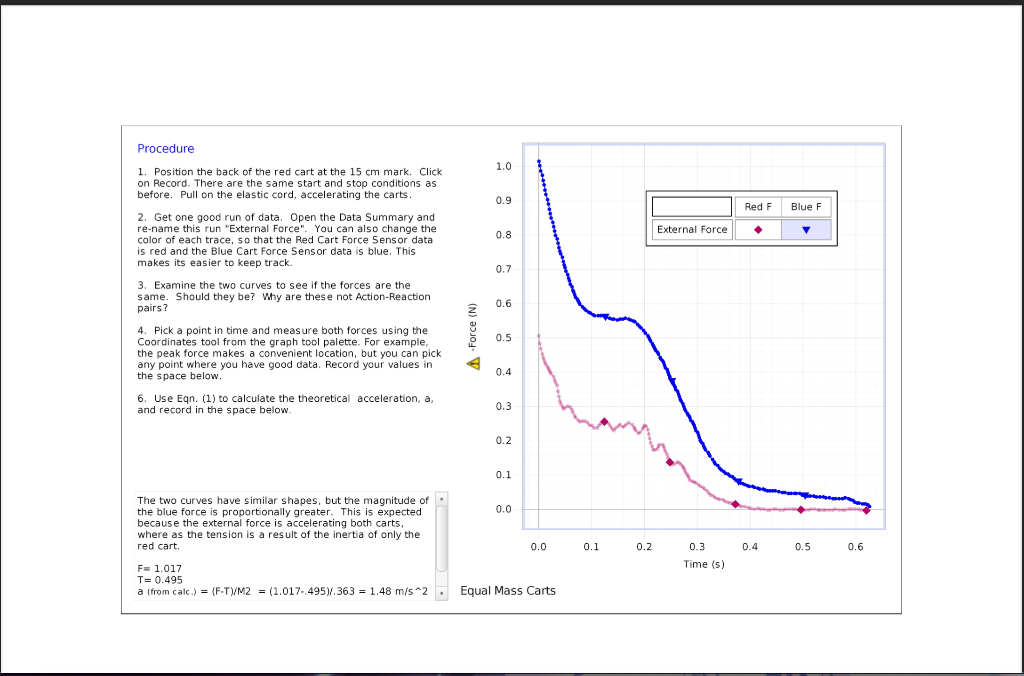
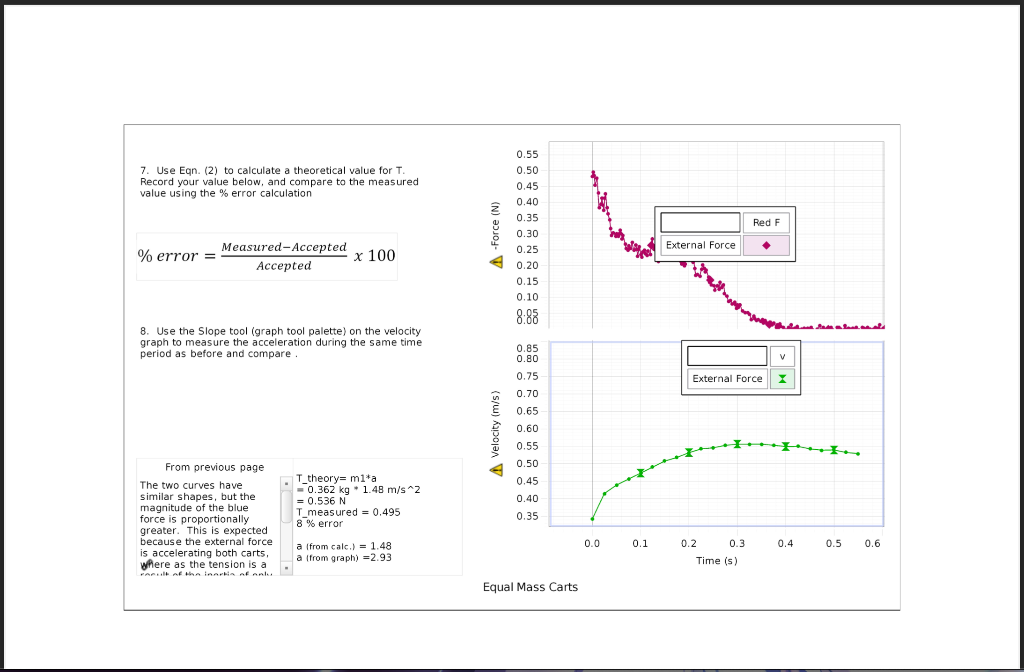
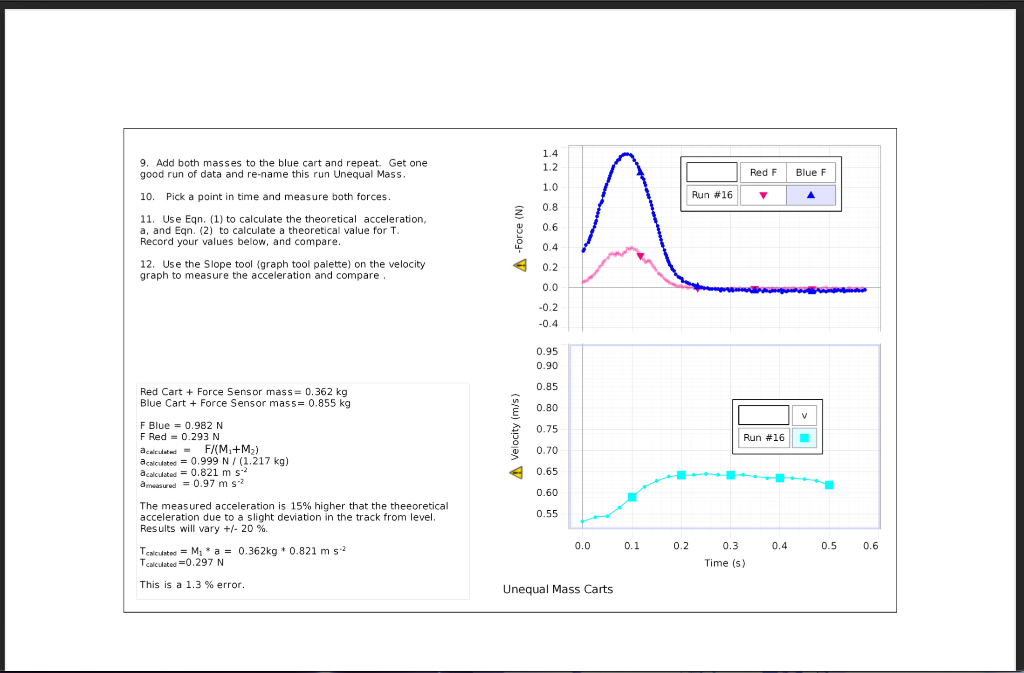
Lab 19: External Forces and the 3rd Law Force Sensor String Elastic Cord PASCOL PASCO Figure 1. The two carts are accelerated to the right by pulling on the elastic cord. Introduction Equipment Qty Items Part Number In the first part of the experiment (shown above), the forces are examined that are exerted on the two sensors by the connecting exerted by hand on the elastic cord, is In the second part of the experiment, the external force, is compared to forces created by the tension in the string. the internal Dynamics System 5955 2 Force Sensor PS-2189 1 Motion Sensor PS-2103A 2 Compact Cart Mass ME-6755 Elastic Cord (In ME-8998) Braided String SE-8050 Required but not included Balance SE-8723 Written by Jon Hanks Motion Sensor: P1 Red Cart Force: P3 Cart Mass Blue Cart Force: P4 Figure 2. Set-up for measuring Action-Reaction pairs Set-up Thumbscrew 1. Set up the track as shown in Figure 2 with feet and endstop. Note the orientation of the yellow rule: The Motion Sensor will be on the zero end. 2. Place the carts on the track and level the track enough so that the carts don't begin to roll 3. Connect the Motion Sensor to the PASPORT input P1. Attach it to the track and adjust the alignment knob on the side of the Motion Sensor so that it points parallel to the track. Make sure the switch on the top of the Motion Sensor is set to "cart." PASCar 4. Using long thumbscrews, attach the Force Sensors to the carts as shown in Figure 3. Note the orientation of the two carts (see Fig. 2): It is best to have them both facing the direction as shown, so that the magnets in the ends of the carts do not interact. Figure 3. Attaching Force Sensor to cart. 0.50 0.45 5. Use the Balance to record the mass of Cart + Force Sensor for both carts. 6. Plug the Force Sensor on the red cart into input P3 and the Force Sensor on the blue cart into input P4. Position the cords so they have as little effect as possible. 7. With nothing touching the hooks on the Force Sensors, press the "ZERO" buttons on the Force Sensors. Position the red cart about 30 cm from the Motion Sensor and click on Monitor Action-Reaciton 0.40 A Position (m) 0.35 0.30 0.25 0.20 8. Move the cart away from the Motion Sensor about 30 cm and then back. Check the Position and Velocity graphs to ensure that you are getting good, smooth, continous data. Click on Stop. . 9. Cut a piece of string about 25 cm in length. Tie non-slip loops on each end, with the final length of the string about 10 cm to 15 cm. This string connects the two Force Sensors, as shown in Figure 1. 10. Cut a piece of elastic cord about 30 cm long, Attach one end to the blue cart as shown in Figure 1 11. Practice (without recording data) pulling on the carts with the elastic cord. Start with the back end (nearest the Motion Sensor) of the red cart at the 15 cm mark. In the following sections, this will always be the starting position. 12. Hold the elastic cord to put a small amount of tension in the string connecting the two sensors without causing them to accelerate yet. Then pull on the cord, accelerating the carts. Pull in such a way that the string stays in tension as far as possible 0.75 0.70 0.65 V Action-Reacion 0.60 A Velocity (m/s) 0.55 0.50 0.45 0.40 0.35 0.30 0.25 0.0 0.1 0.4 0.5 Red Cart + Force Sensor mass= 362 g Blue Cart + Force Sensor mass= 353 g 0.2 0.3 Time (s) Testing Motion Sensor Procedure 0.0 1. Position the back of the red cart at the 15 cm mark. Click on Record. Data collection will NOT start until the cart reaches a position of 20 cm, due to an initial starting condition. You can stop recording at any time, but there is an automatic stop condition that stops the recording when the cart reaches 50 cm. -0.5 -1.0 2. Pull on the elastic cord, accelerating the carts. Red F Blue F -1.5 Action-Reaciton 7 -2.0 3. Get one good run of data. Open the Data Summary and re-name this run "Action-Reaction". You can also change the color of each trace, so that the Red Cart Force Sensor data is red and the Blue Cart Force Sensor data is blue. This makes its easier to keep track. 4. Examine the two curves to see if the forces exerted are the same. You will probably have trouble seeing the two sets of data at the same time. The best way is to toggle back and forth between the two data sets. In the Graph Legend, click on the icon under "Red F" to highlight that data. Then click on the icon under "Blue Fto highlight that data. Go back an forth and see if you can detect any difference. -2.5 A Force (N) 4 -3.0 -3.5 -4.0 5. Are the action/reaction forces equal in magnitude (size)? 6. Place both Cart Masses in the red cart and repeat the procedure Place both Cart Masses in the blue cart and repeat the procedure. Are the action/reaction forces still equal in magnitude? -4.5 -5.0 Yes, the action and reaction forces are equal in size within experimental error independent of the masses of the carts. -5.5 0.0 0.1 0.2 0.5 0.6 0.7 0.3 0.4 Time (5) Action-Reaction Pairs Set-up String Thumbscrew Elastic Cord 1. Move the Force Sensor on the blue cart to the opposite end as shown in Figure 4. Do not just turn the cart around because the magnets in the ends of the carts would interact. 2. The string connecting the carts should now be fastened to the thumbs crew on the back of the Force Sensor on the blue cart (see Fig. 4) and the Elastic Cord is connected to the Force Sensor hook. PASCO PASCA Figure 4. Set-up for measuring internal and external forces 3. The black Cart Mass is shown in the photo to make the string show up better, but start with no masses in the trays. 4. You will pull on the Elastic Cord to accelerate the carts in the same manner as before. However, the Force Sensor on the blue cart will now measure the External Force you apply to the system. The Force Sensor on the red cart will measure the tension in the string as before T Mi M2 F F Figure 5. Force Diagram Theory The two masses can also be treated separately. What is the direction that the internal force, T, exerts on M ? On M2? Applying the 2nd law to M, yields An external force, F, is applied to the two mass system (as shown in Figure 5) causing an acceleration, a. The two masses are connected by a string with tension, T. Applying the 2nd Law to the system yields T= M. a Egn. (2) and applying the 2nd law to Mz yields F-T= M2 a Egn. (3) Show that Eqn. (2) and Eqn. (3) combine into Eqn. (1) . ) 1 F = (M +M)a Egn. (1) Procedure 1.0 0.9 Red F Blue F 1. Position the back of the red cart at the 15 cm mark. Click on Record. There are the same start and stop conditions as before. Pull on the elastic cord, accelerating the carts. 2. Get one good run of data. Open the Data Summary and re-name this run "External Force". You can also change the color of each trace, so that the Red Cart Force Sensor data is red and the Blue Cart Force Sensor data is blue. This makes its easier to keep track. External Force 0.8 0.7 3. Examine the two curves to see if the forces are the same. Should they be? Why are these not Action-Reaction pairs? 0.6 A-Force (N) 0.5 4. Pick a point in time and measure both forces using the Coordinates tool from the graph tool palette. For example, the peak force makes a convenient location, but you can pick any point where you have good data. Record your values in the space below. 6. Use Egn. (1) to calculate the theoretical acceleration, a, and record in the space below. 0.4 0.3 0.2 0.1 0.0 The two curves have similar shapes, but the magnitude of the blue force is proportionally greater. This is expected because the external force is accelerating both carts, where as the tension is a result of the inertia of only the red cart. 0.0 0.1 0.2 0.3 0.4 0.5 0.6 Time (s) F= 1.017 T= 0.495 a (from calc.) = {F-T)/2 = (1.017-495.363 = 1.48 m/s^2 . Equal Mass Carts 7. Use Egn. (2) to calculate a theoretical value for T Record your value below, and compare to the measured value using the % error calculation 0.55 0.50 0.45 0.40 Red F A-Force (N) External Force . % error = Measured - Accepted x 100 Accepted 0.35 20 0.30 0.25 0.20 0.15 0.10 8:08 8. Use the Slope tool (graph tool palette) on the velocity graph to measure the acceleration during the same time period as before and compare 0.85 0.80 V External Force z A Velocity (m/s) 0.75 0.70 0.65 0.60 0.55 0.50 0.45 From previous page The two curves have similar shapes, but the magnitude of the blue force is proportionally greater. This is expected because the external force is accelerating both carts, Where as the tension is a T_theory= mita -0.362 kg * 1.48 m/s^2 = 0.536 N N T_measured = 0.495 0.40 0.35 8% error 0.0 0.1 0.4 0.5 0.6 a from calc.) = 1.48 a from graph) = 2.93 0.2 0.3 Time (s) Equal Mass Carts 1.4 1.2 Red F Blue F 1.0 Run #16 A 0.8 9. Add both masses to the blue cart and repeat. Get one good run of data and re-name this run Unequal Mass. 10. Pick a point in time and measure both forces. . 11. Use Egn. (1) to calculate the theoretical acceleration, a, and Eqn. (2) to calculate a theoretical value for T. Record your values below, and compare. 12. Use the Slope tool (graph tool palette) on the velocity graph to measure the acceleration and compare 0.6 A-Force (N) 0.4 0.2 0.0 -0.2 -0.4 0.95 0.90 0.85 Red Cart + Force Sensor mass= 0.362 kg Blue Cart + Force Sensor mass= 0.855 kg 0.80 V 0.75 A Velocity (m/s) Run #16 F Blue = 0.982 N F Red = 0.293 N acalculated - F/(M+M2) a calculated 0.999 N / (1.217 kg) a calculated = 0.821 m s2 med = 0.97 m s? 0.70 0.65 0.60 The measured acceleration is 15% higher that the theeoretical acceleration due to a slight deviation in the track from level. . Results will vary +/- 20 % 0.55 0.0 0.1 0.2 0.4 0.5 0.6 Tcalculated = M*a = 0.362kg * 0.821 m 2 + Tcalculated 0.297 N 0.3 Time (s) This is a 1.3 % error. Unequal Mass Carts Lab 19: External Forces and the 3rd Law Force Sensor String Elastic Cord PASCOL PASCO Figure 1. The two carts are accelerated to the right by pulling on the elastic cord. Introduction Equipment Qty Items Part Number In the first part of the experiment (shown above), the forces are examined that are exerted on the two sensors by the connecting exerted by hand on the elastic cord, is In the second part of the experiment, the external force, is compared to forces created by the tension in the string. the internal Dynamics System 5955 2 Force Sensor PS-2189 1 Motion Sensor PS-2103A 2 Compact Cart Mass ME-6755 Elastic Cord (In ME-8998) Braided String SE-8050 Required but not included Balance SE-8723 Written by Jon Hanks Motion Sensor: P1 Red Cart Force: P3 Cart Mass Blue Cart Force: P4 Figure 2. Set-up for measuring Action-Reaction pairs Set-up Thumbscrew 1. Set up the track as shown in Figure 2 with feet and endstop. Note the orientation of the yellow rule: The Motion Sensor will be on the zero end. 2. Place the carts on the track and level the track enough so that the carts don't begin to roll 3. Connect the Motion Sensor to the PASPORT input P1. Attach it to the track and adjust the alignment knob on the side of the Motion Sensor so that it points parallel to the track. Make sure the switch on the top of the Motion Sensor is set to "cart." PASCar 4. Using long thumbscrews, attach the Force Sensors to the carts as shown in Figure 3. Note the orientation of the two carts (see Fig. 2): It is best to have them both facing the direction as shown, so that the magnets in the ends of the carts do not interact. Figure 3. Attaching Force Sensor to cart. 0.50 0.45 5. Use the Balance to record the mass of Cart + Force Sensor for both carts. 6. Plug the Force Sensor on the red cart into input P3 and the Force Sensor on the blue cart into input P4. Position the cords so they have as little effect as possible. 7. With nothing touching the hooks on the Force Sensors, press the "ZERO" buttons on the Force Sensors. Position the red cart about 30 cm from the Motion Sensor and click on Monitor Action-Reaciton 0.40 A Position (m) 0.35 0.30 0.25 0.20 8. Move the cart away from the Motion Sensor about 30 cm and then back. Check the Position and Velocity graphs to ensure that you are getting good, smooth, continous data. Click on Stop. . 9. Cut a piece of string about 25 cm in length. Tie non-slip loops on each end, with the final length of the string about 10 cm to 15 cm. This string connects the two Force Sensors, as shown in Figure 1. 10. Cut a piece of elastic cord about 30 cm long, Attach one end to the blue cart as shown in Figure 1 11. Practice (without recording data) pulling on the carts with the elastic cord. Start with the back end (nearest the Motion Sensor) of the red cart at the 15 cm mark. In the following sections, this will always be the starting position. 12. Hold the elastic cord to put a small amount of tension in the string connecting the two sensors without causing them to accelerate yet. Then pull on the cord, accelerating the carts. Pull in such a way that the string stays in tension as far as possible 0.75 0.70 0.65 V Action-Reacion 0.60 A Velocity (m/s) 0.55 0.50 0.45 0.40 0.35 0.30 0.25 0.0 0.1 0.4 0.5 Red Cart + Force Sensor mass= 362 g Blue Cart + Force Sensor mass= 353 g 0.2 0.3 Time (s) Testing Motion Sensor Procedure 0.0 1. Position the back of the red cart at the 15 cm mark. Click on Record. Data collection will NOT start until the cart reaches a position of 20 cm, due to an initial starting condition. You can stop recording at any time, but there is an automatic stop condition that stops the recording when the cart reaches 50 cm. -0.5 -1.0 2. Pull on the elastic cord, accelerating the carts. Red F Blue F -1.5 Action-Reaciton 7 -2.0 3. Get one good run of data. Open the Data Summary and re-name this run "Action-Reaction". You can also change the color of each trace, so that the Red Cart Force Sensor data is red and the Blue Cart Force Sensor data is blue. This makes its easier to keep track. 4. Examine the two curves to see if the forces exerted are the same. You will probably have trouble seeing the two sets of data at the same time. The best way is to toggle back and forth between the two data sets. In the Graph Legend, click on the icon under "Red F" to highlight that data. Then click on the icon under "Blue Fto highlight that data. Go back an forth and see if you can detect any difference. -2.5 A Force (N) 4 -3.0 -3.5 -4.0 5. Are the action/reaction forces equal in magnitude (size)? 6. Place both Cart Masses in the red cart and repeat the procedure Place both Cart Masses in the blue cart and repeat the procedure. Are the action/reaction forces still equal in magnitude? -4.5 -5.0 Yes, the action and reaction forces are equal in size within experimental error independent of the masses of the carts. -5.5 0.0 0.1 0.2 0.5 0.6 0.7 0.3 0.4 Time (5) Action-Reaction Pairs Set-up String Thumbscrew Elastic Cord 1. Move the Force Sensor on the blue cart to the opposite end as shown in Figure 4. Do not just turn the cart around because the magnets in the ends of the carts would interact. 2. The string connecting the carts should now be fastened to the thumbs crew on the back of the Force Sensor on the blue cart (see Fig. 4) and the Elastic Cord is connected to the Force Sensor hook. PASCO PASCA Figure 4. Set-up for measuring internal and external forces 3. The black Cart Mass is shown in the photo to make the string show up better, but start with no masses in the trays. 4. You will pull on the Elastic Cord to accelerate the carts in the same manner as before. However, the Force Sensor on the blue cart will now measure the External Force you apply to the system. The Force Sensor on the red cart will measure the tension in the string as before T Mi M2 F F Figure 5. Force Diagram Theory The two masses can also be treated separately. What is the direction that the internal force, T, exerts on M ? On M2? Applying the 2nd law to M, yields An external force, F, is applied to the two mass system (as shown in Figure 5) causing an acceleration, a. The two masses are connected by a string with tension, T. Applying the 2nd Law to the system yields T= M. a Egn. (2) and applying the 2nd law to Mz yields F-T= M2 a Egn. (3) Show that Eqn. (2) and Eqn. (3) combine into Eqn. (1) . ) 1 F = (M +M)a Egn. (1) Procedure 1.0 0.9 Red F Blue F 1. Position the back of the red cart at the 15 cm mark. Click on Record. There are the same start and stop conditions as before. Pull on the elastic cord, accelerating the carts. 2. Get one good run of data. Open the Data Summary and re-name this run "External Force". You can also change the color of each trace, so that the Red Cart Force Sensor data is red and the Blue Cart Force Sensor data is blue. This makes its easier to keep track. External Force 0.8 0.7 3. Examine the two curves to see if the forces are the same. Should they be? Why are these not Action-Reaction pairs? 0.6 A-Force (N) 0.5 4. Pick a point in time and measure both forces using the Coordinates tool from the graph tool palette. For example, the peak force makes a convenient location, but you can pick any point where you have good data. Record your values in the space below. 6. Use Egn. (1) to calculate the theoretical acceleration, a, and record in the space below. 0.4 0.3 0.2 0.1 0.0 The two curves have similar shapes, but the magnitude of the blue force is proportionally greater. This is expected because the external force is accelerating both carts, where as the tension is a result of the inertia of only the red cart. 0.0 0.1 0.2 0.3 0.4 0.5 0.6 Time (s) F= 1.017 T= 0.495 a (from calc.) = {F-T)/2 = (1.017-495.363 = 1.48 m/s^2 . Equal Mass Carts 7. Use Egn. (2) to calculate a theoretical value for T Record your value below, and compare to the measured value using the % error calculation 0.55 0.50 0.45 0.40 Red F A-Force (N) External Force . % error = Measured - Accepted x 100 Accepted 0.35 20 0.30 0.25 0.20 0.15 0.10 8:08 8. Use the Slope tool (graph tool palette) on the velocity graph to measure the acceleration during the same time period as before and compare 0.85 0.80 V External Force z A Velocity (m/s) 0.75 0.70 0.65 0.60 0.55 0.50 0.45 From previous page The two curves have similar shapes, but the magnitude of the blue force is proportionally greater. This is expected because the external force is accelerating both carts, Where as the tension is a T_theory= mita -0.362 kg * 1.48 m/s^2 = 0.536 N N T_measured = 0.495 0.40 0.35 8% error 0.0 0.1 0.4 0.5 0.6 a from calc.) = 1.48 a from graph) = 2.93 0.2 0.3 Time (s) Equal Mass Carts 1.4 1.2 Red F Blue F 1.0 Run #16 A 0.8 9. Add both masses to the blue cart and repeat. Get one good run of data and re-name this run Unequal Mass. 10. Pick a point in time and measure both forces. . 11. Use Egn. (1) to calculate the theoretical acceleration, a, and Eqn. (2) to calculate a theoretical value for T. Record your values below, and compare. 12. Use the Slope tool (graph tool palette) on the velocity graph to measure the acceleration and compare 0.6 A-Force (N) 0.4 0.2 0.0 -0.2 -0.4 0.95 0.90 0.85 Red Cart + Force Sensor mass= 0.362 kg Blue Cart + Force Sensor mass= 0.855 kg 0.80 V 0.75 A Velocity (m/s) Run #16 F Blue = 0.982 N F Red = 0.293 N acalculated - F/(M+M2) a calculated 0.999 N / (1.217 kg) a calculated = 0.821 m s2 med = 0.97 m s? 0.70 0.65 0.60 The measured acceleration is 15% higher that the theeoretical acceleration due to a slight deviation in the track from level. . Results will vary +/- 20 % 0.55 0.0 0.1 0.2 0.4 0.5 0.6 Tcalculated = M*a = 0.362kg * 0.821 m 2 + Tcalculated 0.297 N 0.3 Time (s) This is a 1.3 % error. Unequal Mass Carts
Step by Step Solution
There are 3 Steps involved in it

Get step-by-step solutions from verified subject matter experts