

Answered step by step
Verified Expert Solution
Question
1 Approved Answer
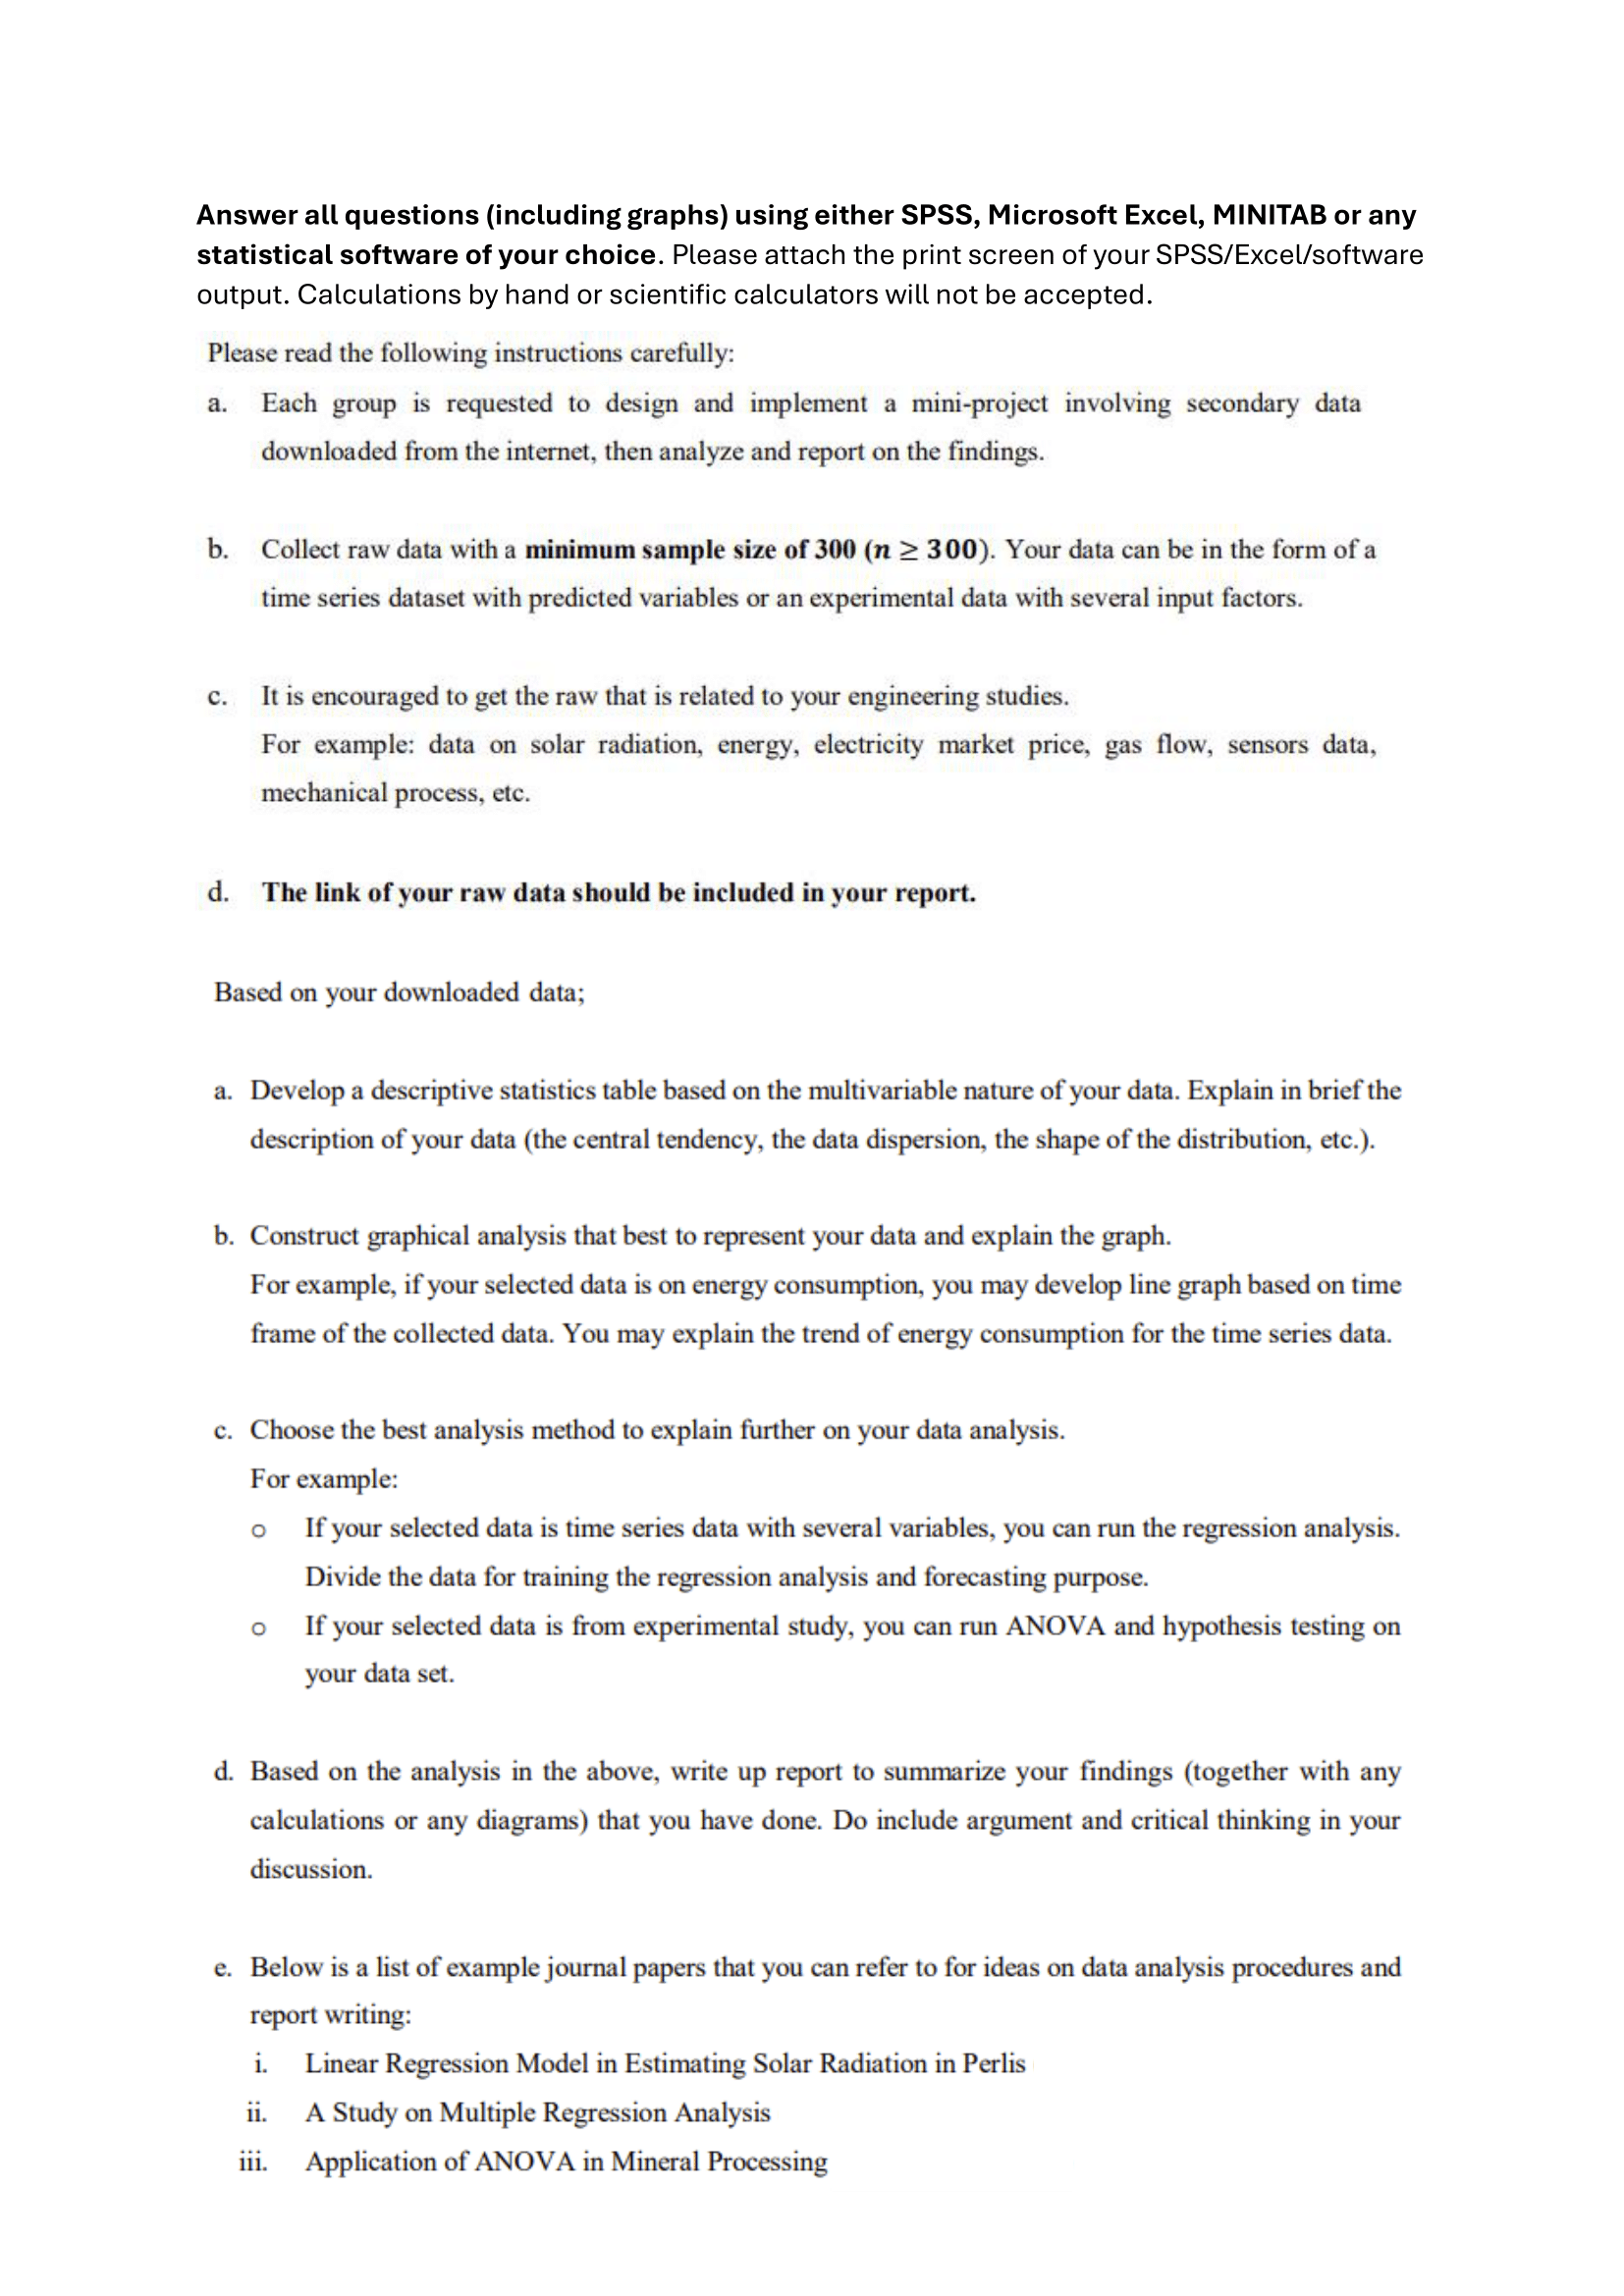
Answer all questions ( including graphs ) using either SPSS , Microsoft Excel, MINITAB, Python or any statistical software of your choice. Please attach the
Answer all questions including graphs using either SPSS Microsoft Excel, MINITAB, Python or any
statistical software of your choice. Please attach the print screen of your SPSSExcelsoftwareScript
output. Calculations by hand or scientific calculators will not be accepted.
Please read the following instructions carefully:
a You are requested to design and implement a miniproject involving secondary data
downloaded from the internet, then analyze and report on the findings.
b Collect raw data with a minimum sample size of n Your data can be in the form of a
time series dataset with predicted variables or an experimental data with several input factors.
c It is encouraged to get the raw that is related to your engineering studies.
For example: data on solar radiation, energy, electricity market price, gas flow, sensors data, mechanical process, etc.
d The link of your raw data should be included in your report.
Based on your downloaded data;
a Develop a descriptive statistics table based on the multivariable nature of your data. Explain in brief the description of your data the central tendency, the data dispersion, the shape of the distribution, etc.
b Construct graphical analysis that best to represent your data and explain the graph.
For example,
if your selected data is on energy consumption, you may develop line graph based on time frame of the collected data. You may explain the trend of energy consumption for the time series data.
c Choose the best analysis method to explain further on your data analysis.
For example:
If your selected data is time series data with several variables, you can run the regression analysis. Divide the data for training the regression analysis and forecasting purpose.
If your selected data is from experimental study, you can run ANOVA and hypothesis testing on your data set.
d Based on the analysis in the above, write up report to summarize your findings together with any calculations or any diagrams that you have done. Do include argument and critical thinking in your
discussion.
e Below is a list of example journal papers that you can refer to for ideas on data analysis procedures and report writing:
i Linear Regression Model in Estimating Solar Radiation in Perlis
ii A Study on Multiple Regression Analysis
iii. Application of ANOVA in Mineral Processing
Step by Step Solution
There are 3 Steps involved in it
Step: 1

Get Instant Access to Expert-Tailored Solutions
See step-by-step solutions with expert insights and AI powered tools for academic success
Step: 2

Step: 3
Ace Your Homework with AI
Get the answers you need in no time with our AI-driven, step-by-step assistance
Get Started
Modern Database Management
Authors: Donald A. Carpenter Fred R. McFadden
1st Edition
8178088045, 978-8178088044