Answered step by step
Verified Expert Solution
Link Copied!

Question

1 Approved Answer

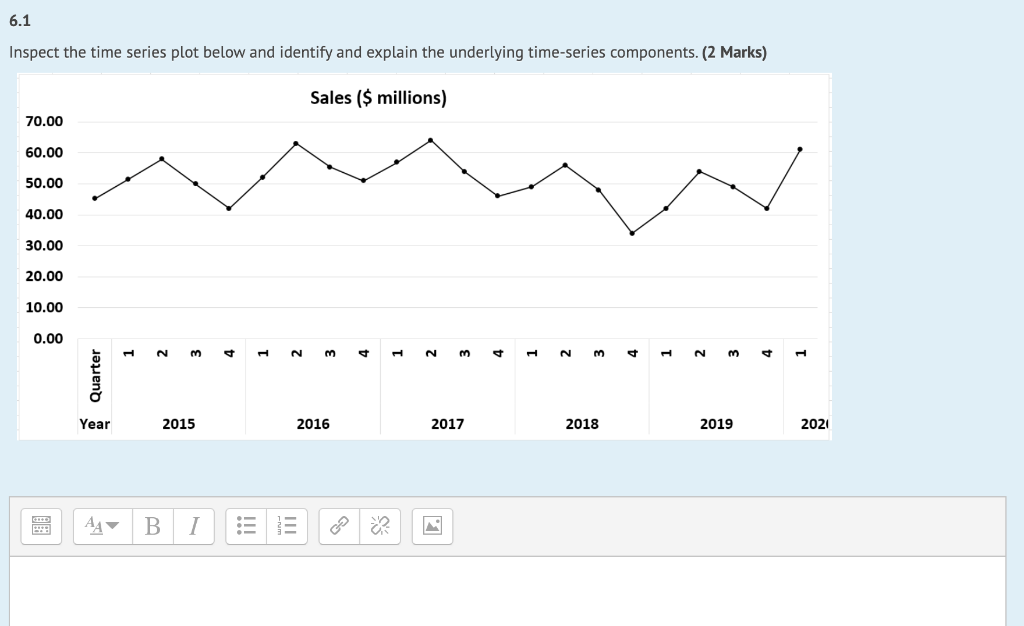
Answer all questions with explanation 6.1 Inspect the time series plot below and identify and explain the underlying time-series components. (2 Marks) Sales ($ millions)

Answer all questions with explanation

image text in transcribedimage text in transcribed
6.1 Inspect the time series plot below and identify and explain the underlying time-series components. (2 Marks) Sales ($ millions) 70.00 60.00 50.00 40.00 30.00 20.00 10.00 0.00 H N m HN m + N m + HNm + Quarter Year 2015 2016 2017 2018 2019 2021 AAV B Ib. A time-series graph is produced for the above table and a linear equation is generated as below. Profit in $m 40 30 Profits $m 20 y = 2.9697t + 6.2667 10 R2 = 0.8081 0 1 2 3 4 Time periods Profit . Linear (Profit) Using the equation, forecast the profit in $ millions for periods 15 and 20. (2 Marks)

Step by Step Solution

There are 3 Steps involved in it

Step: 1

blur-text-image

Get Instant Access to Expert-Tailored Solutions

See step-by-step solutions with expert insights and AI powered tools for academic success

Step: 2

blur-text-image

Step: 3

blur-text-image

Ace Your Homework with AI

Get the answers you need in no time with our AI-driven, step-by-step assistance

Get Started

Recommended Textbook for

Intermediate Algebra

Authors: Marvin L Bittinger

11th Edition

0321968395, 9780321968395

More Books

Students also viewed these Mathematics questions

Question

Who needs to interface with the master production schedule and why?

Answered: 1 week ago