

Answered step by step
Verified Expert Solution
Question
1 Approved Answer
Answer ALL the following questions PERANGKAAN UTAMA PERKHIDMATAN BAS, 1971 - 2015, MALAYSIA Principal Statistics of Bus Services, 1971 - 2015, Malaysia Tahun Bilangan Pekerja
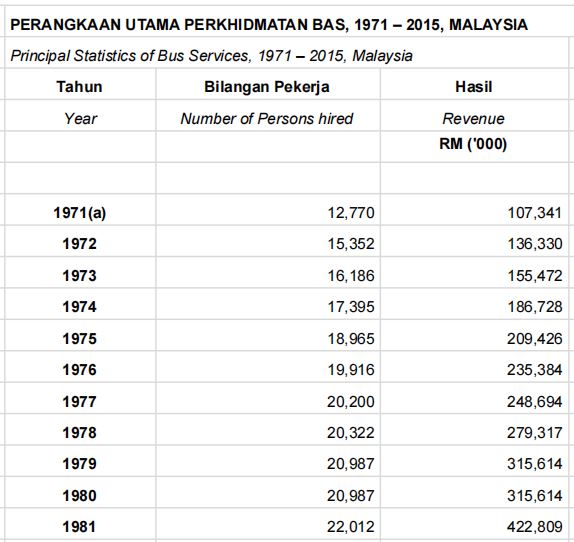

Answer ALL the following questions


Step by Step Solution
There are 3 Steps involved in it
Step: 1

Get Instant Access to Expert-Tailored Solutions
See step-by-step solutions with expert insights and AI powered tools for academic success
Step: 2

Step: 3
Ace Your Homework with AI
Get the answers you need in no time with our AI-driven, step-by-step assistance
Get Started
Organic Chemistry
Authors: Francis A. Carey
4th edition
0072905018, 978-0072905014