Answered step by step
Verified Expert Solution
Question
1 Approved Answer
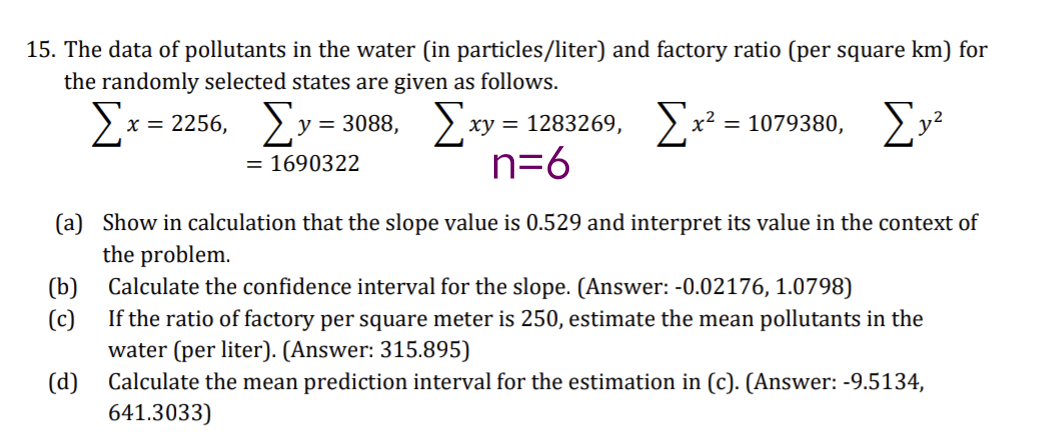
Answer all the question above. n=6 5. The data of pollutants in the water (in particles/liter) and factory ratio (per square km) for the randomly

Answer all the question above.
n=6
5. The data of pollutants in the water (in particles/liter) and factory ratio (per square km) for the randomly selected states are given as follows. x=2256,=1690322y=3088,xy=1283269,x2=1079380,y2 (a) Show in calculation that the slope value is 0.529 and interpret its value in the context of the problem. (b) Calculate the confidence interval for the slope. (Answer: -0.02176, 1.0798) (c) If the ratio of factory per square meter is 250 , estimate the mean pollutants in the water (per liter). (Answer: 315.895) (d) Calculate the mean prediction interval for the estimation in (c). (Answer: -9.5134, 641.3033)Step by Step Solution
There are 3 Steps involved in it
Step: 1

Get Instant Access to Expert-Tailored Solutions
See step-by-step solutions with expert insights and AI powered tools for academic success
Step: 2

Step: 3

Ace Your Homework with AI
Get the answers you need in no time with our AI-driven, step-by-step assistance
Get Started


