Answer appropriately.
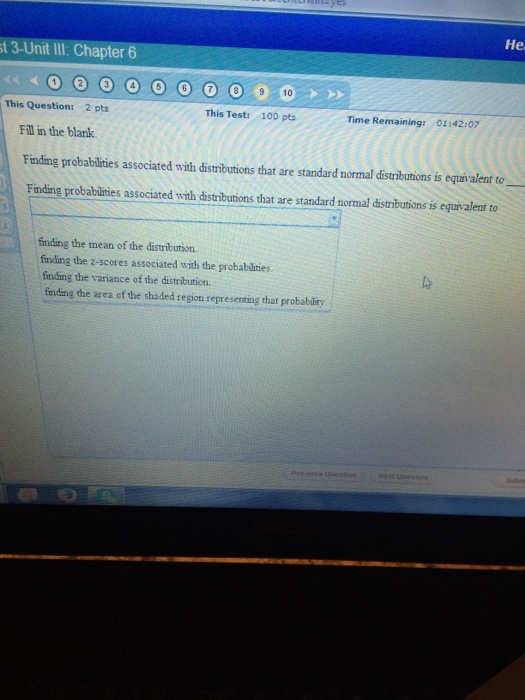
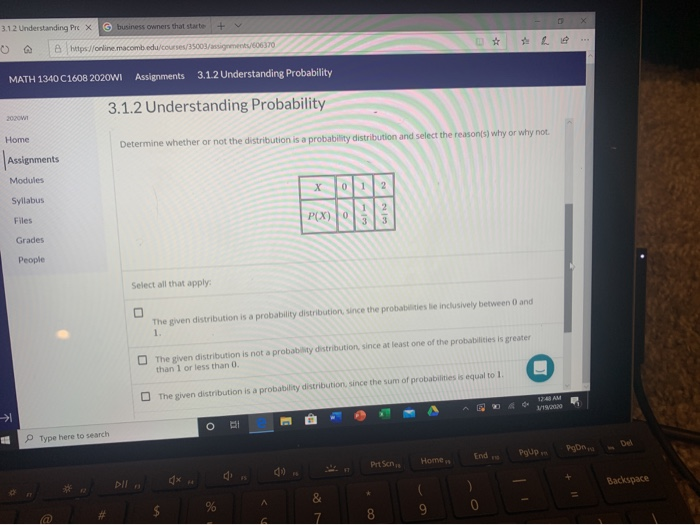
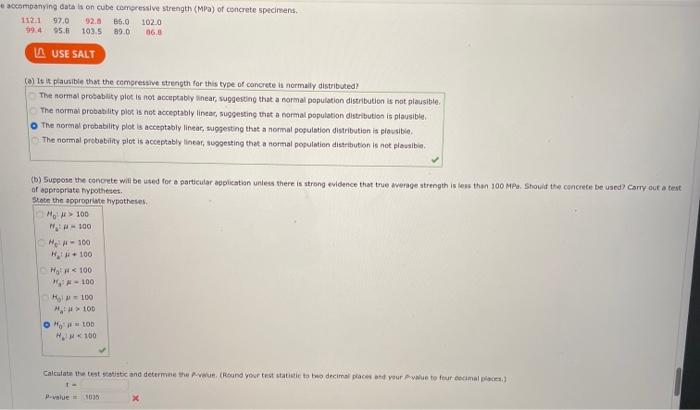
2. Find the probability distribution for flipping 4 coins, looking at the number of heads. Then, find the following: (a) Find the mean of the probability distribution (b) Find the variance of the probability distribution (c) Find the standard deviation of the probability distribution 3. Find the probability distribution for rolling a pair of 4-sided dice. Then, find the following: (a) Find the mean of the probability distribution (using the sum of the rolls) (b) Find the variance of the probability distribution (c) Find the standard deviation of the probability distributionHe t 3-Unit Ill: Chapter 6 2 3 4 7 8 9 10 This Question: 2 pts This Test: 100 pts Time Remaining: 01:42:07 Fill in the blank. Finding probabilities associated with distributions that are standard normal distributions is equivalent to Finding probabilities associated with distributions that are standard normal distributions is equivalent to finding the mean of the distribution. finding the z-scores associated with the probabilities. finding the variance of the distribution. finding the area of the shaded region representing that probability Pronoun Question3.1.2 Understanding Pre x 3) business owners that starter + w X MATH 1340 C1608 2020WI Assignments 3.1.2 Understanding Probability 3.1.2 Understanding Probability Home Determine whether or not the distribution is a probability distribution and select the reason(s) why or why not. Assignments Modules Syllabus X Files P(X) Grades People Select all that apply: The given distribution is a probability distribution, since the probables be inclusively between 0 and The given distribution is not a probability distribution, since at least one of the probabilities is greater than 1 or less than 0. The given distribution is a probability distribution, since the sum of probabilities is equal to 1. 17:48 AM A Type here to search O PgUP In Prt Schips Home BackspaceWhat do we call a continuous random variable in which any two intervals of equal length are equally likely? O Uniform Probability Distribution O Normal Probability Distribution O Binomial Probability Distribution O Independent Probability DistributionDocompanying data Is on cube comesessive strength (MPa) of concrete specimens. 1121 97.0 492.8 65.0 102 0 09 4 95.# 103 5 80.0 LA USE SALT al It A plausible that the compressive strength for this type of concrete is normally distributed? The normal probability plot is not acceptably near, suggesting that a normal population distribution is not plausible; The normal probability plot is not acceptably linear, suggesting that a normal population distribution is plausible. The normal probability plot is acceptably linear, suggesting that a normal population distribution is plac sible. The normal probability plot is acceptably linear, suggesting that a normal population distribution is not plausible. (b) Supposn the concrete will be used for a particular application unless there is strong evidence that true average strength is less than 100 MPs. Should the concrete be used? Carry out a best Hate the appropriate hypotheses; ALI's 100 MEN = 100 HI - 100 HIM . 100 Calculate the best statistic and determine the Assun, (RSand your fest staticlie in two decimal places bed your Pryluin to four Decimal places,] Devalue 1035


