

Answered step by step
Verified Expert Solution
Question
1 Approved Answer
answer as soon as possible Balance Sheet All numbers in thousands Breakdown 2019- 2018 2017- Assets Current Assets Cash Cash And Cash Equivalents 3,093 1

answer as soon as possible
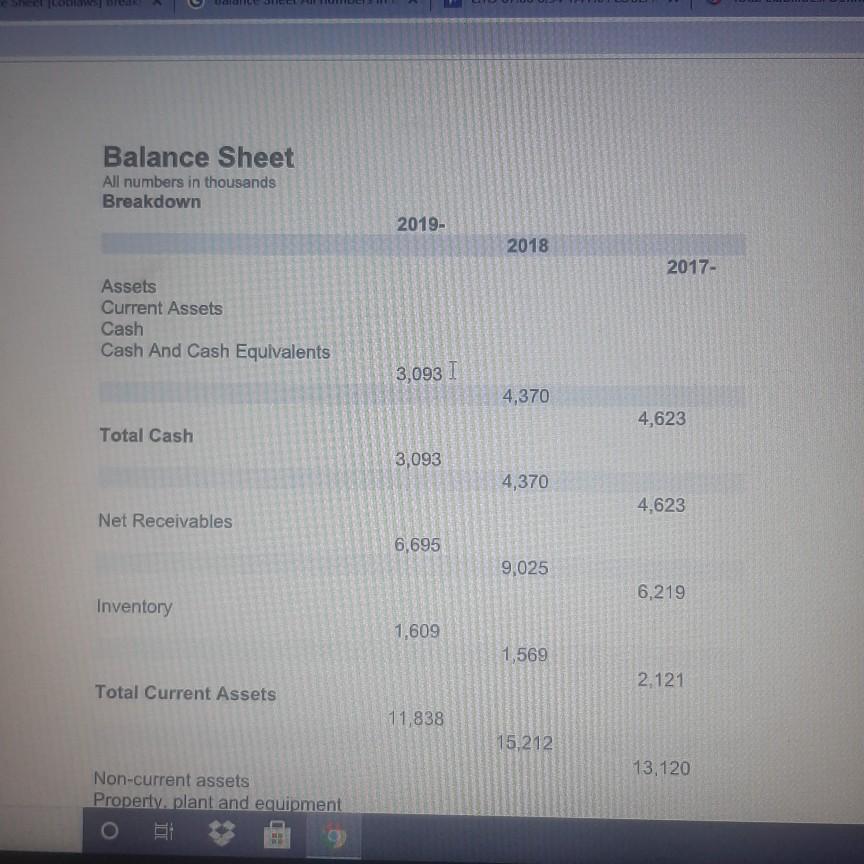
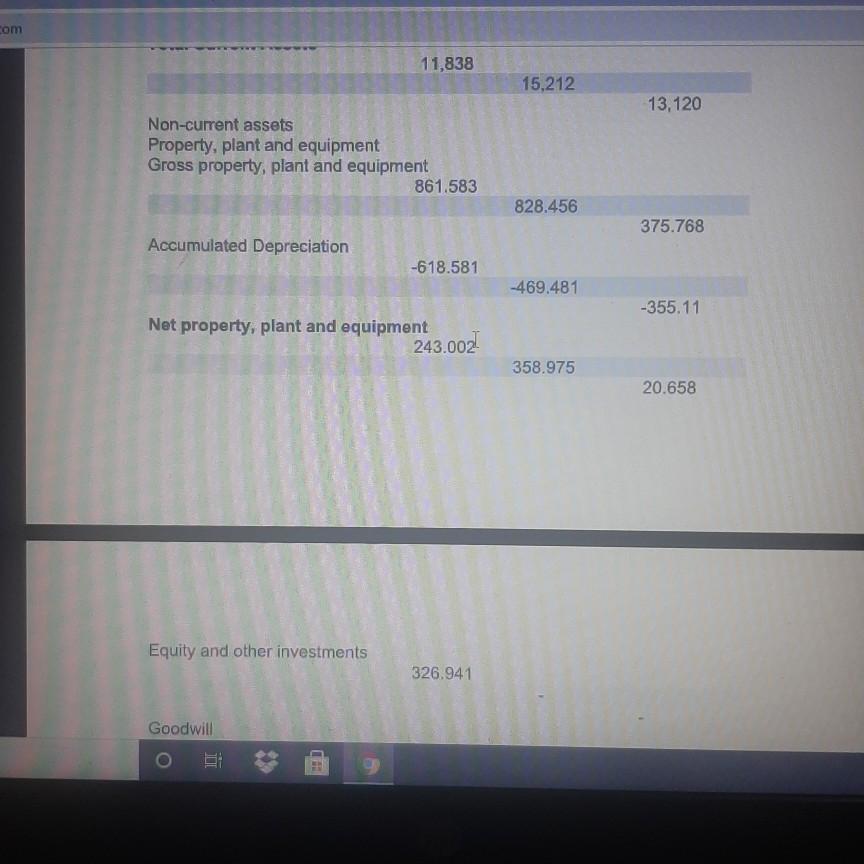
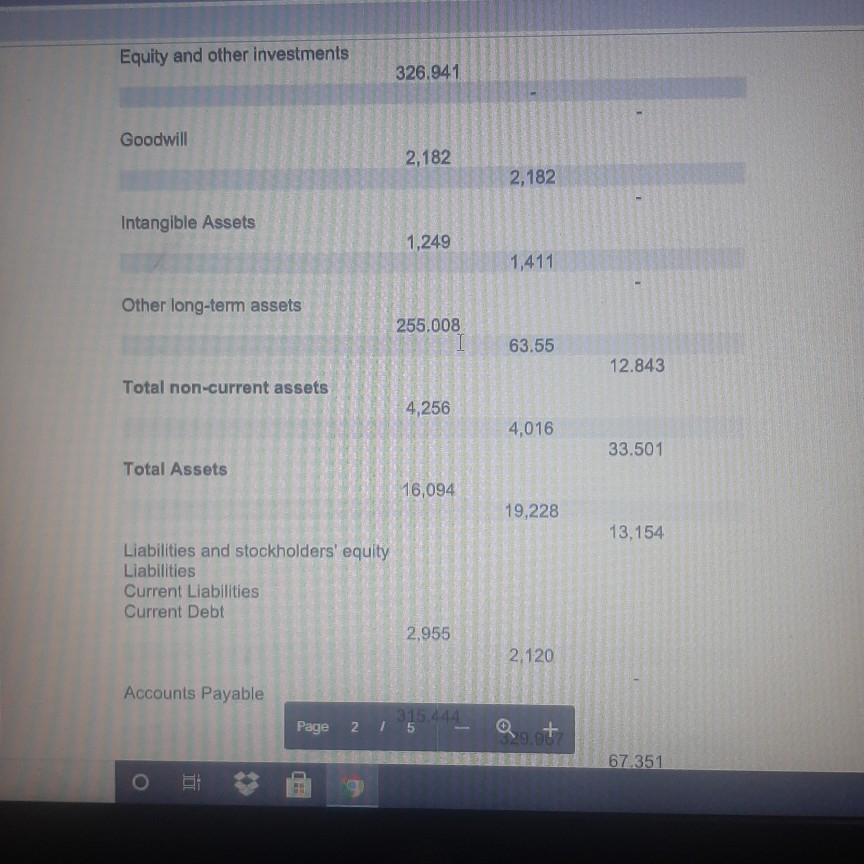
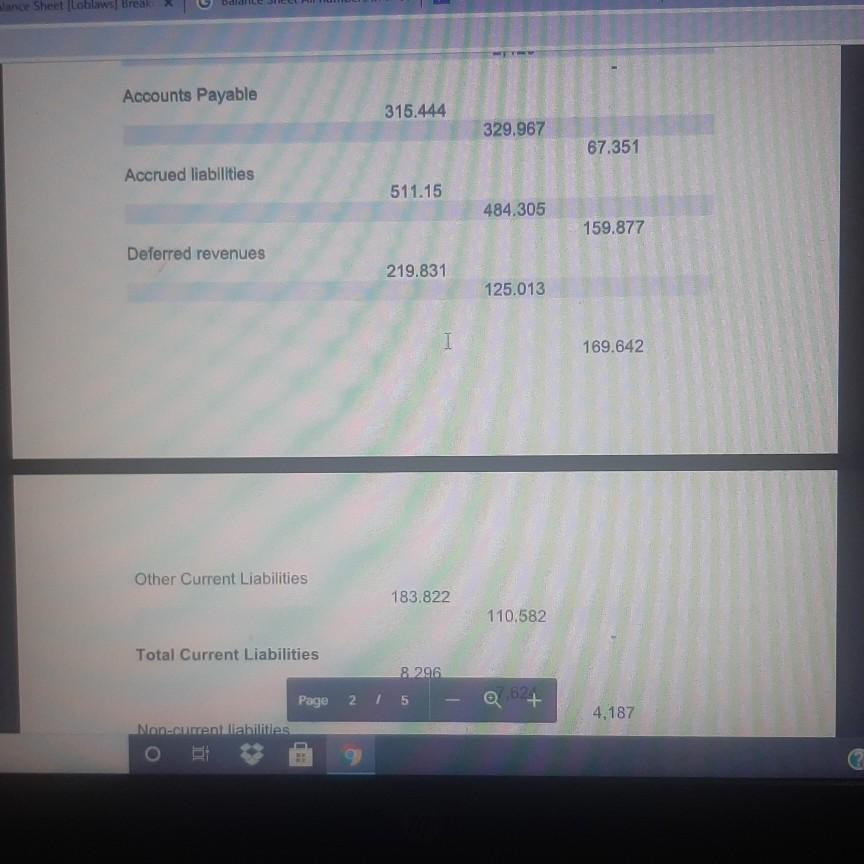
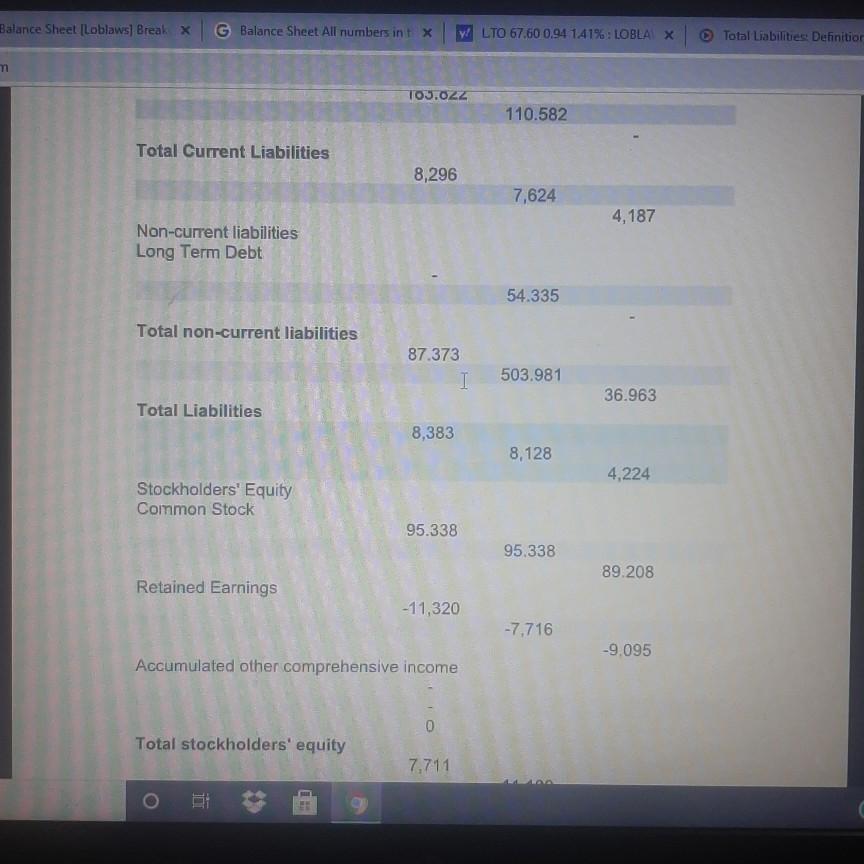
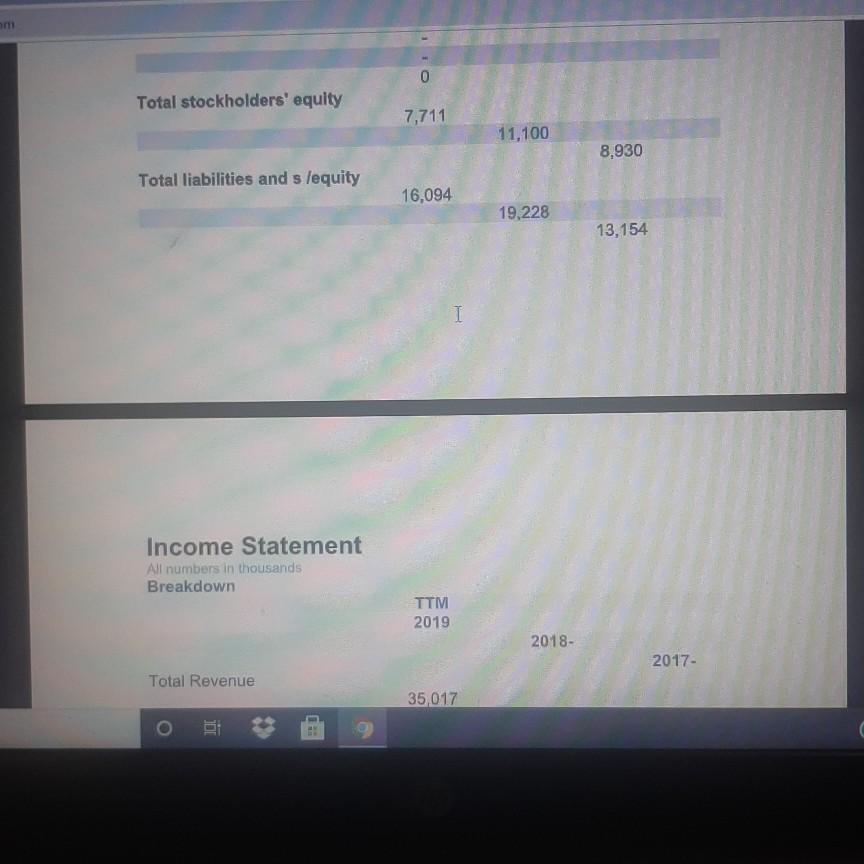
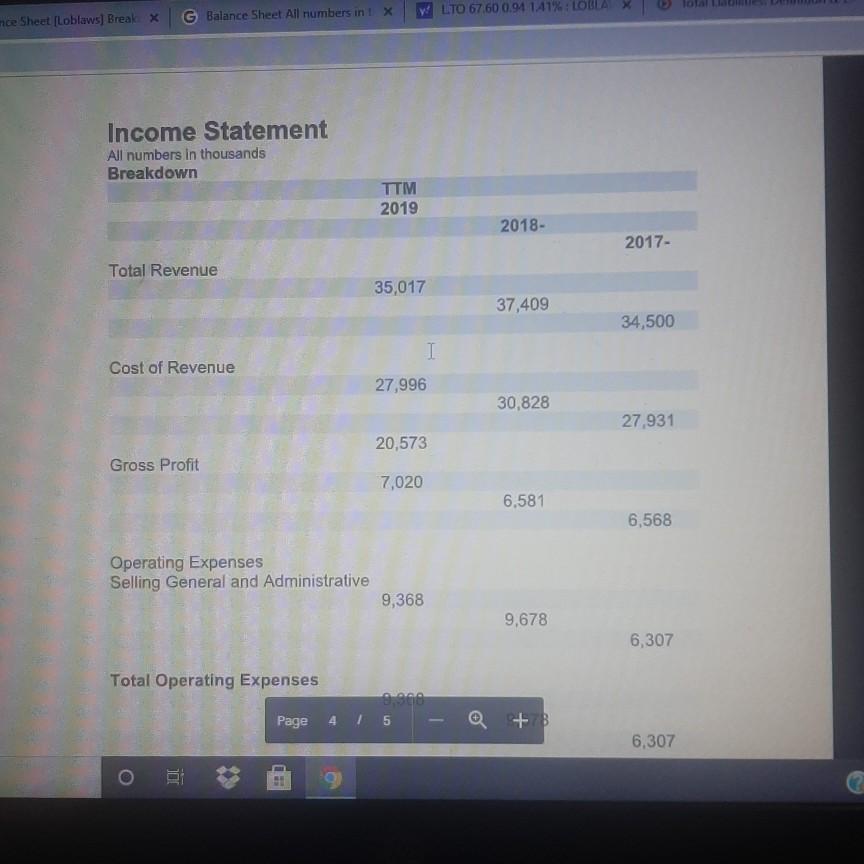
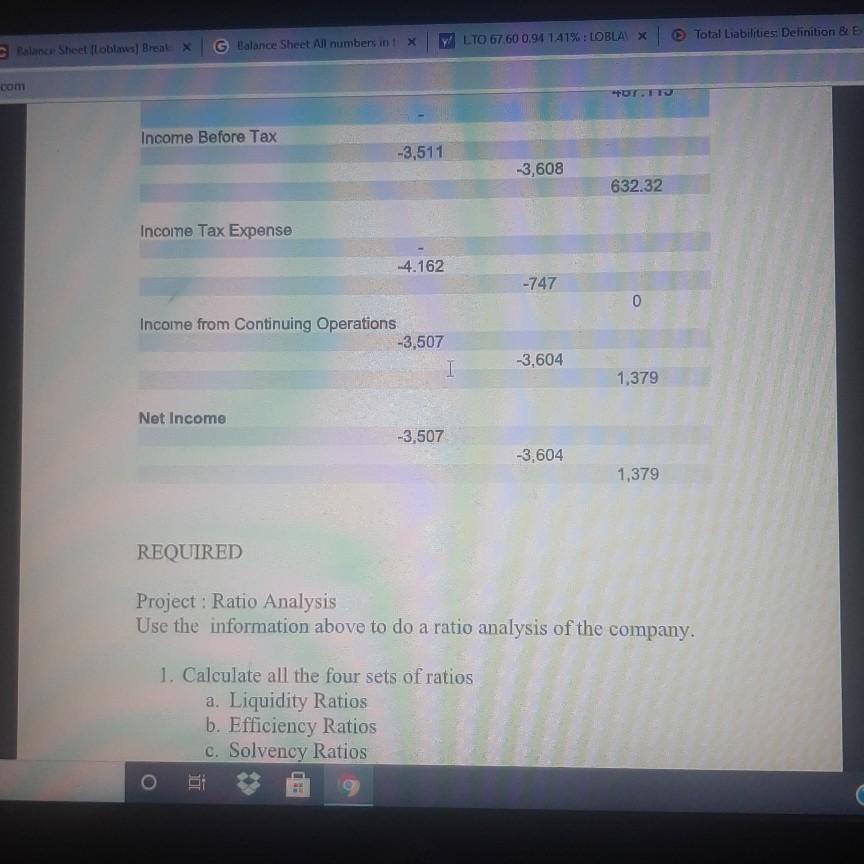
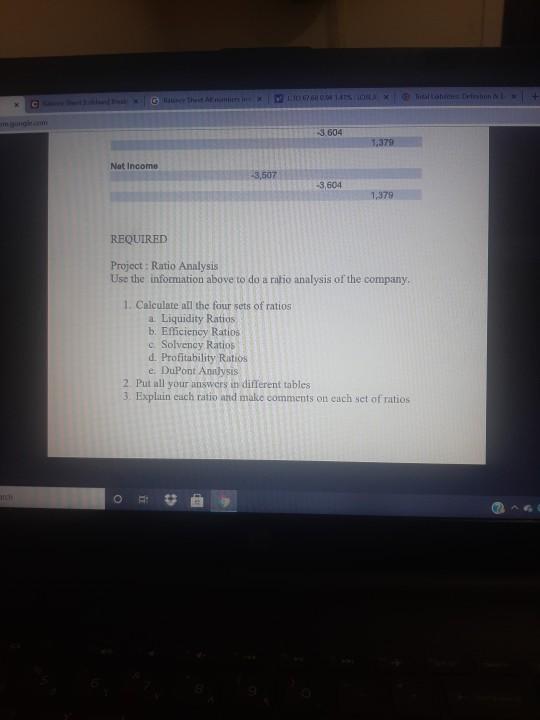
Balance Sheet All numbers in thousands Breakdown 2019- 2018 2017- Assets Current Assets Cash Cash And Cash Equivalents 3,093 1 4,370 4,623 Total Cash 3,093 4,370 4,623 Net Receivables 6,695 9,025 6,219 Inventory 1,609 1,569 2.121 Total Current Assets 11,838 15,212 13.120 Non-current assets Property, plant and equipment com 11,838 15,212 13,120 Non-current assets Property, plant and equipment Gross property, plant and equipment 861.583 828.456 375.768 Accumulated Depreciation -618.581 -469.481 -355.11 Net property, plant and equipment 243.002 358.975 20.658 Equity and other investments 326.941 Goodwill Equity and other investments 326.941 1 Goodwill 2,182 2,182 Intangible Assets 1,249 1,411 Other long-term assets 255.008 I 63.55 12.843 Total non-current assets 4,256 4,016 33.501 Total Assets 16,094 19,228 13,154 Liabilities and stockholders' equity Liabilities Current Liabilities Current Debt 2,955 2,120 Accounts Payable 315.444 2 1 5 Page + 67.351 o ance Sheet Loblaws Break Accounts Payable 315.444 329.967 67.351 Accrued liabilities 511.15 484.305 159.877 Deferred revenues 219.831 125.013 169.642 Other Current Liabilities 183.822 110.582 Total Current Liabilities 8. 296 624 2 / 5 @ + Page Non-cument liabilities 4.187 Balance Sheet [Loblaws Break X G Balance Sheet All numbers int x y! LTO 67.60 0.94 141% : LOBLA X Total Liabilities: Definition TOS.OZZ 110.582 Total Current Liabilities 8,296 7,624 4,187 Non-current liabilities Long Term Debt 54.335 Total non-current liabilities 87.373 I 503.981 36.963 Total Liabilities 8,383 8,128 4,224 Stockholders' Equity Common Stock 95.338 95.338 89.208 Retained Earnings -11,320 -7,716 -9.095 Accumulated other comprehensive income 0 Total stockholders' equity 7,711 0 Total stockholders' equity 7,711 11,100 8,930 Total liabilities and s lequity 16,094 19,228 13,154 I Income Statement All numbers in thousands Breakdown ITV 2019 2018- 2017- Total Revenue 35,017 nce Sheet [Loblaws) Break X G Balance Sheet All numbers in X Y LTO 67.60 0.94 141% LOLLAX Income Statement All numbers in thousands Breakdown TTM 2019 2018- 2017- Total Revenue 35,017 37,409 34,500 I Cost of Revenue 27,996 30,828 27,931 20,573 Gross Profit 7,020 6,581 6,568 Operating Expenses Selling General and Administrative 9,368 9,678 6,307 Total Operating Expenses Page 4 / 5 6,307 Total Operating Expenses 9,368 9,678 6,307 Operating Income or Loss -2,348 -3,097 260.652 Interest Expense 182.975 201.004 I 115.447 Total Other Income/Expenses Net -980.536 -309.805 487.115 Page 15 Income Before Tax LTO 67.60 0.94 141% : LOBLAX Total Liabilities Definition BE Balance Sheet lobos) Breal X G Balance Sheet All numbers int .com UT.IT Income Before Tax -3,511 -3,608 632.32 Income Tax Expense 4.162 -747 0 Income from Continuing Operations -3,507 I -3,604 1,379 Net Income -3,507 -3,604 1,379 REQUIRED Project: Ratio Analysis Use the information above to do a ratio analysis of the company. 1. Calculate all the four sets of ratios a. Liquidity Ratios b. Efficiency Ratios c. Solvency Ratios obrt 3.604 1,379 Nat Income -3,507 -3,604 1,379 REQUIRED Project: Ratio Analysis Use the information above to do a ratio analysis of the company 1. Calculate all the four sets of ratios a Liquidity Ratios b. Efficiency Ratios Solvency Ratios d. Profitability Ratios e DuPont Antysis 2 Put all your answers in different tables 3. Explain each ratio and make comments on each set of ratios oStep by Step Solution
There are 3 Steps involved in it
Step: 1

Get Instant Access to Expert-Tailored Solutions
See step-by-step solutions with expert insights and AI powered tools for academic success
Step: 2

Step: 3
Ace Your Homework with AI
Get the answers you need in no time with our AI-driven, step-by-step assistance
Get Started
Artificial Intelligence For Audit, Forensic Accounting, And Valuation A Strategic Perspective
Authors: Al Naqvi
1st Edition
1119601886, 9781119601883