

Answered step by step
Verified Expert Solution
Question
1 Approved Answer
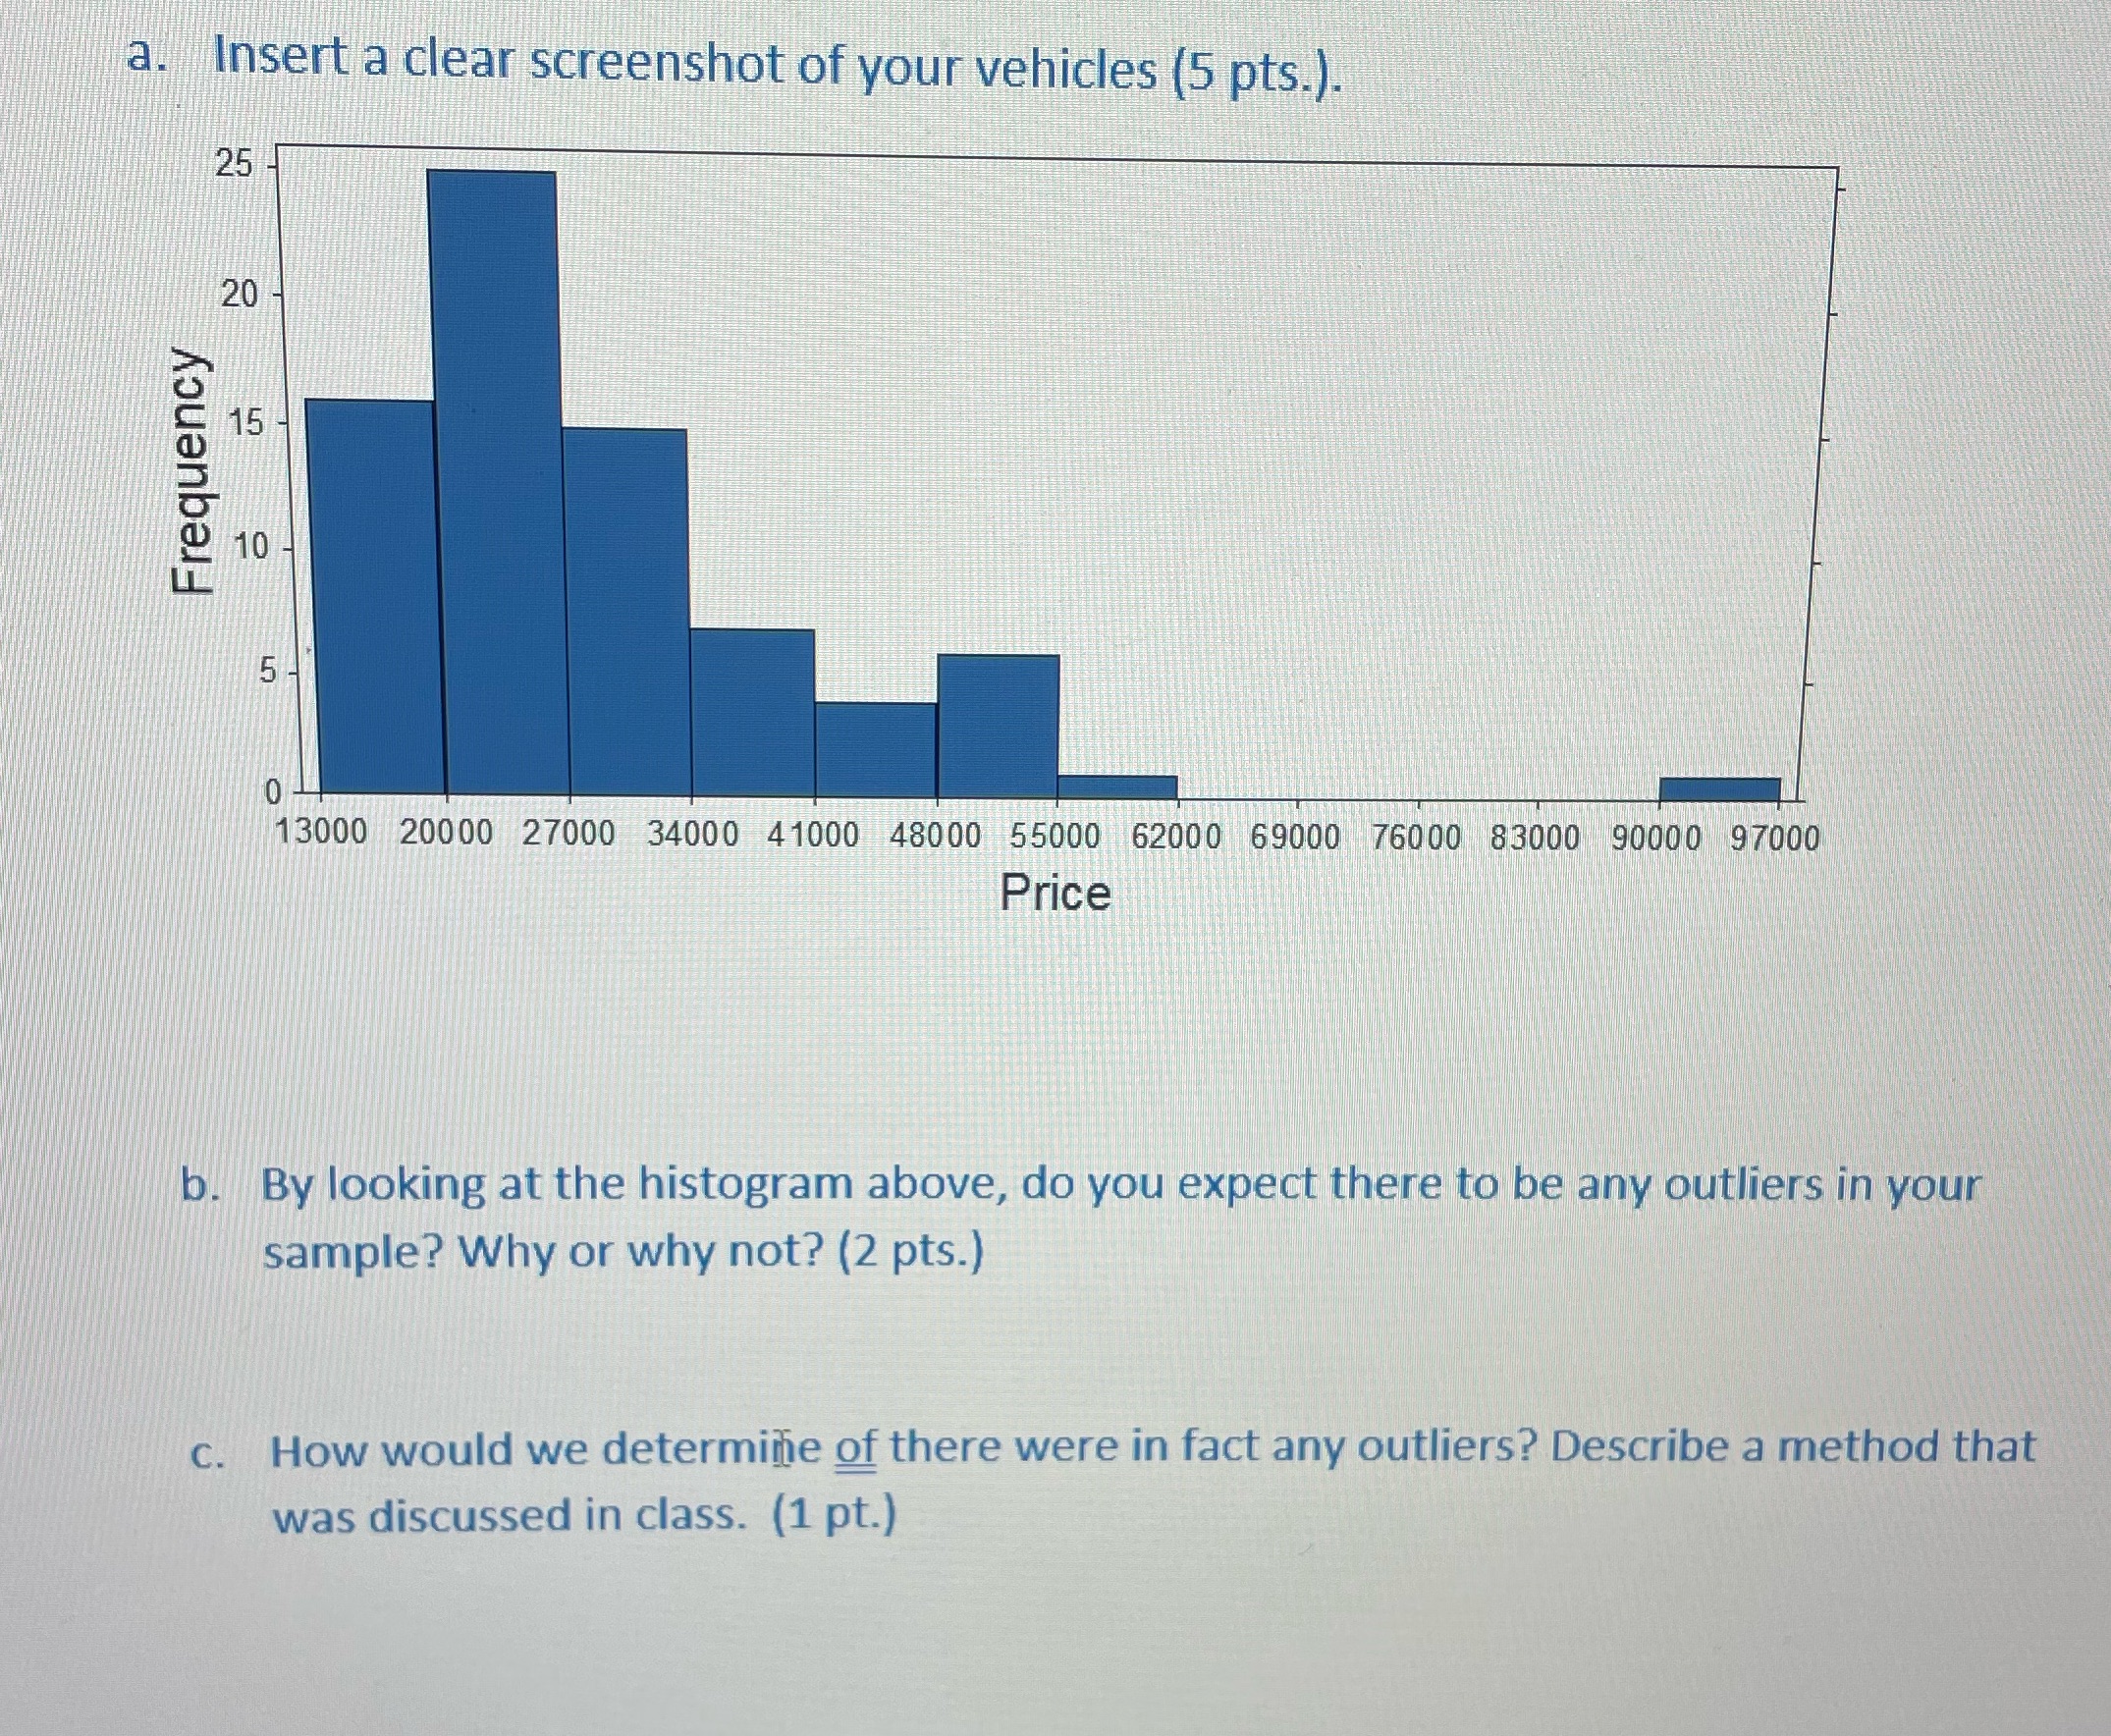
Answer B and C a. Insert a clear screenshot of your vehicles (5 pts.). 25 20 15 Frequency 10 13000 20000 27000 34000 41000 48000
Answer B and C
Step by Step Solution
There are 3 Steps involved in it
Step: 1

Get Instant Access to Expert-Tailored Solutions
See step-by-step solutions with expert insights and AI powered tools for academic success
Step: 2

Step: 3
Ace Your Homework with AI
Get the answers you need in no time with our AI-driven, step-by-step assistance
Get Started
Quantitative Analysis For Management
Authors: Barry Render, Ralph M. Stair, Michael E. Hanna
11th Edition
9780132997621, 132149117, 132997622, 978-0132149112