Answered step by step
Verified Expert Solution
Link Copied!

Question

1 Approved Answer

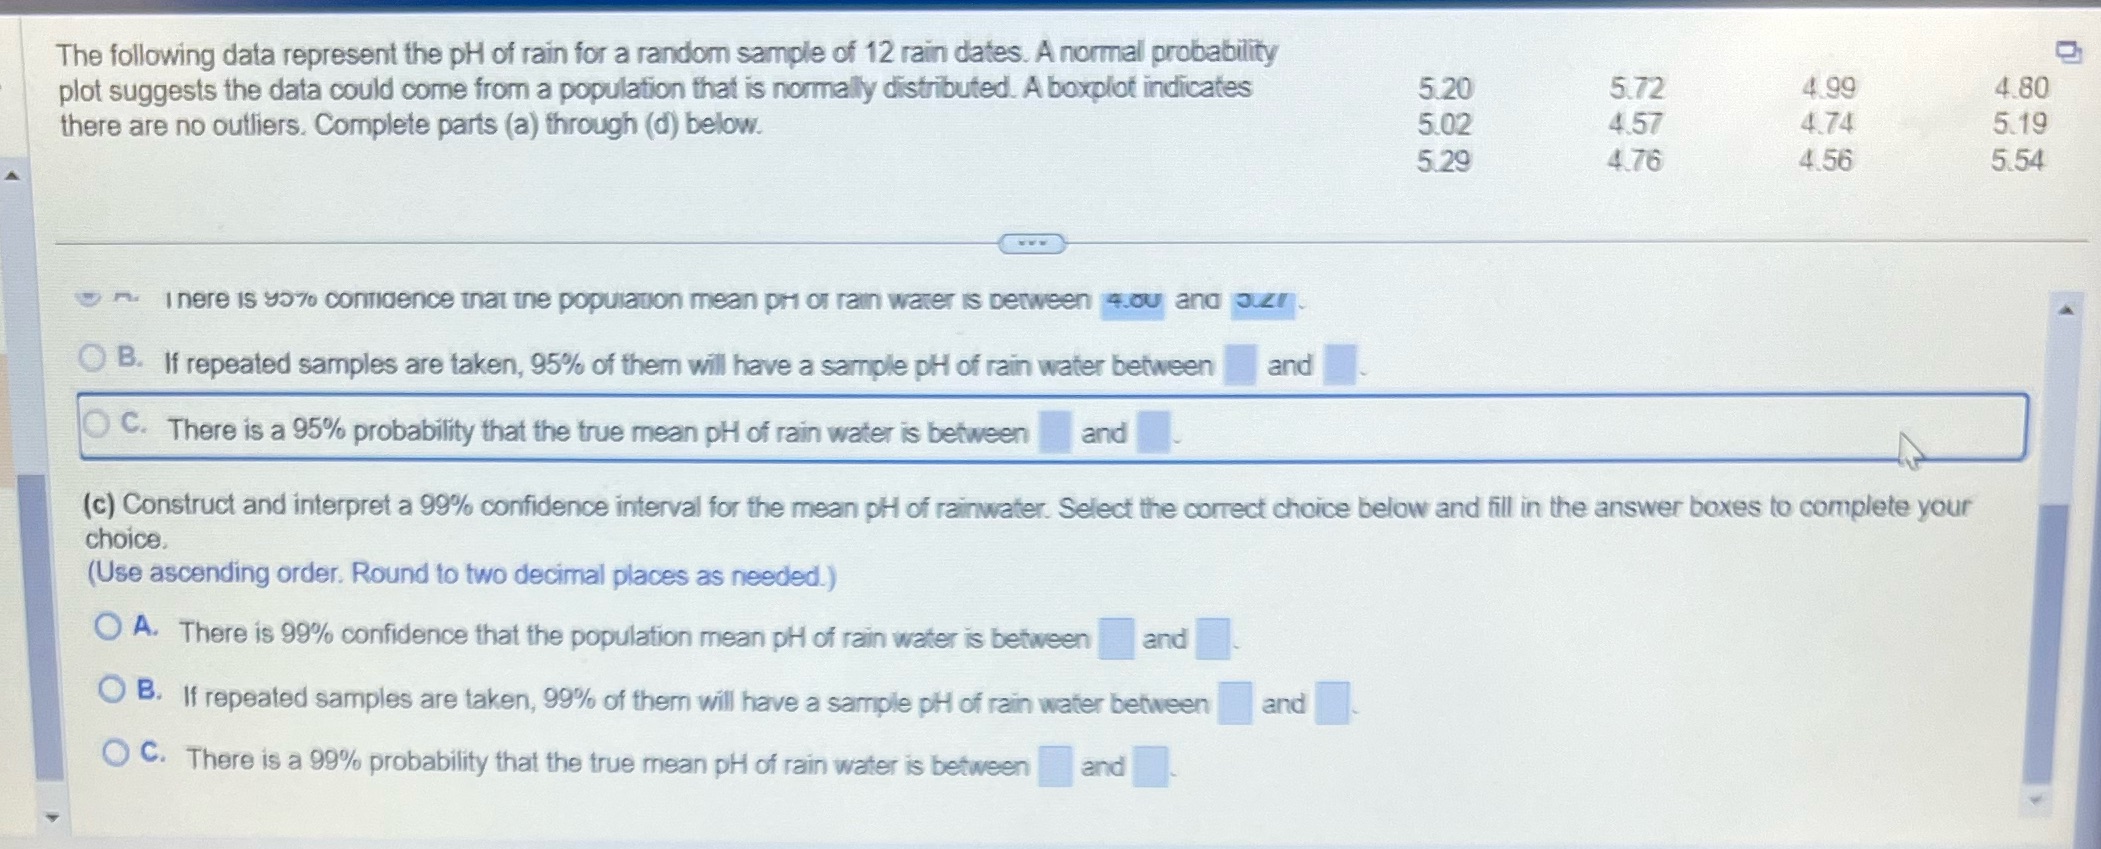
Answer C The following data represent the pH of rain for a random sample of 12 rain dates. A normal probability O plot suggests the

Answer C

image text in transcribed
The following data represent the pH of rain for a random sample of 12 rain dates. A normal probability O plot suggests the data could come from a population that is normally distributed. A boxplot indicates 5.20 5.72 4 99 4.80 there are no outliers. Complete parts (a) through (d) below. 5.02 4.57 4.74 5.19 5.29 4.76 4.56 5.54 inere is 95%% confidence that the population mean pi of rain water is between 4.ou and our O B. If repeated samples are taken, 95% of them will have a sample pH of rain water between and O C. There is a 95% probability that the true mean pH of rain water is between and (c) Construct and interpret a 99% confidence interval for the mean pi of rainwater. Select the correct choice below and fill in the answer boxes to complete your choice. (Use ascending order. Round to two decimal places as needed.) A. There is 99% confidence that the population mean pH of rain water is between and O B. If repeated samples are taken, 99% of them will have a sample pH of rain water between and O C. There is a 99% probability that the true mean pH of rain water is between and

Step by Step Solution

There are 3 Steps involved in it

Step: 1

blur-text-image

Get Instant Access to Expert-Tailored Solutions

See step-by-step solutions with expert insights and AI powered tools for academic success

Step: 2

blur-text-image

Step: 3

blur-text-image

Ace Your Homework with AI

Get the answers you need in no time with our AI-driven, step-by-step assistance

Get Started

Recommended Textbook for

A First Course in General Relativity

Authors: Bernard Schutz

2nd edition

521887054, 978-0521887052

More Books

Students also viewed these Mathematics questions