Answer each section
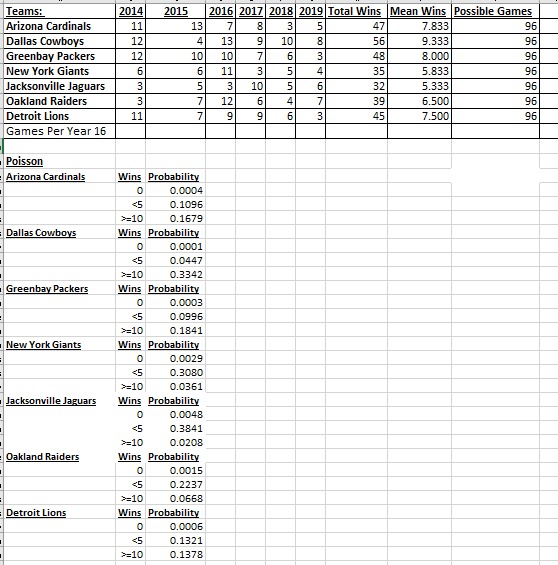
Part 1: Using the preliminary data collected in the Topic 2 assignment, complete two hypothesis tests relevant to the specific requirements of your scenario. To ensure tests are not duplicated, collaborate with the other members of your group to identify specifically which data each person in the group will be utilizing in the hypothesis tests. For example, if you are comparing sports teams, one member of the group might compare the Tigers and the Rams, while another member of the group might compare the Sharks and the Eagles. Using Excel, complete the two hypothesis tests using different data sets at a .05 level of significance. Generate a box plot for each test. The accuracy of formulas and the box plot visuals will be assessed. Part 2 Statistical analysis can create a number of ethical challenges. Review the "Ethical Guidelines for Statistical Practice," "statement on the Integration of Faith and Work," and the servant leadership and conscious capitalism study materials. Consider the principle of "do no harm" and how, through application of a Christian worldview perspective, ethical challenges related to sampling methods, treatment of outliers, selection of levels, or significance can be anticipated and addressed to ensure that statistical analysis is completed effectively, efficiently, and ethically. Provide a 750-1,000 summary of the hypothesis tests and ethical issues related to statistical analysis. The summary should address the following: 1. Summary of the business scenario. 2. Definition of the variables and sources. 3. Rationale for the type of hypothesis tests used. 4. Null and alternative hypothesis. 5. Two hypothesis tests with results that include test statistic, critical value(s), and p-value. 6. Box plot visuals for each hypothesis test. 7. Interpretation of the statistical results of the hypothesis tests. 8. Discussion of potential ethical dilemmas associated with each hypothesis test, including explanation of how the principle of "do no harm" and a Christian worldview perspective could be applied to ensure the statistical analysis was completed ethically. Include discussion of how sampling methods, treatment of outliers, selection of levels, or significance, etc. should be addressed for ethical compliance. 9. Summary of the hypothesis testing results and how these can be applied to the specified business scenario. submit the Excel spreadsheet and Word summary document. While APA style is not required for the body of this assignment, solid academic writing is expected, and documentation of sources should be presented using APA formatting guidelines, which can be found in the APA Style Guide, located in the Student Success Center. This assignment uses a rubric. Please review the rubric prior to beginning the assignment to become familiar with the expectations for successful completion. You are required to submit this assignment to LopesWrite. Refer to the LopesWrite Technical Support articles for assistance. Benchmark Information This benchmark assignment assesses the following programmatic competencies: B5 Business Administration 2.3: Use quantitative techniques and tools to analyze dato relevant to business decision moking. [MC3] B5 Business for Secondary Education 7.3: Use appropriate computer applications to perform mathematical calculations relevant to solving business problems.Teams: 2014 2015 2016 2017 2018 2019 Total Wins Mean Wins |Possible Games Arizona Cardinals 11 13 7 3 47 7.833 96 Dallas Cowboys 12 13 10 56 9.333 96 Greenbay Packers 12 10 10 18 8.000 96 New York Giants 6 6 11 35 5.833 96 Jacksonville Jaguars 3 5 3 10 32 5.333 96 Oakland Raiders 3 12 39 6.500 96 Detroit Lions 11 7 9 6 3 45 7.500 96 Games Per Year 16 Poisson Arizona Cardinals Wins Probability 0 0.0004 =10 0.1679 Dallas Cowboys Wins Probability 0.0001 =10 0.1841 New York Giants Wins Probability 0.0029 0.3080 *=10 0.0361 Jacksonville Jaguars Wins Probability 0.0048 0.3841 >=10 0.0208 Oakland Raiders Wins Probability 0.0015 0.2237 >=10 0.0668 Detroit Lions Wins Probability 0 0.0006 =10 0.1378\f