Answer e-i

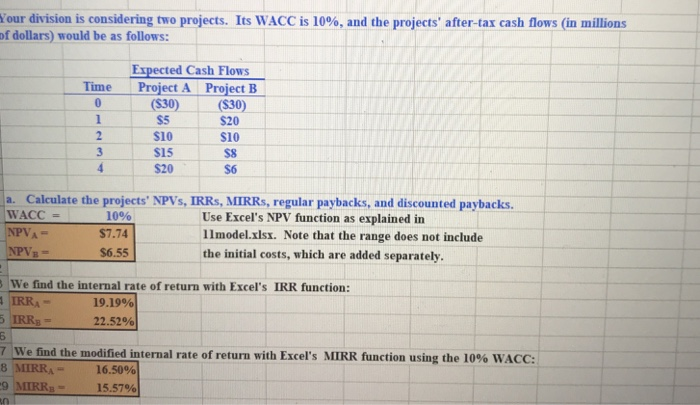
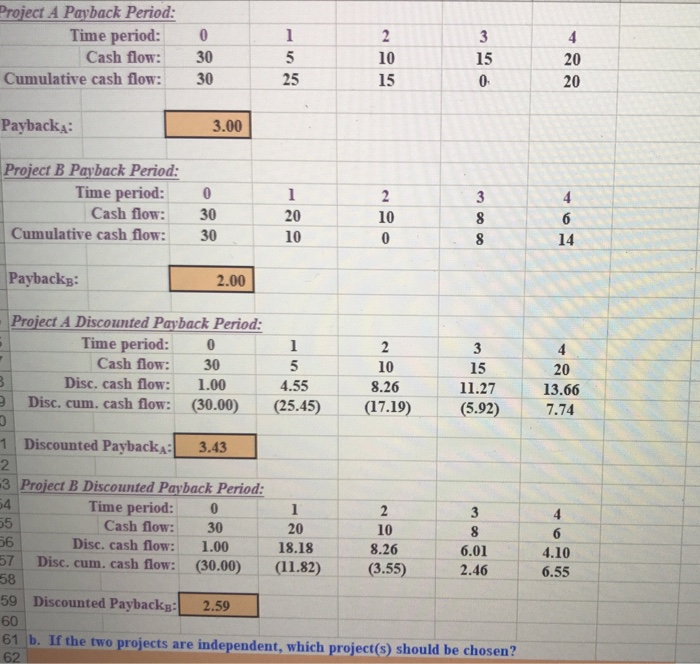
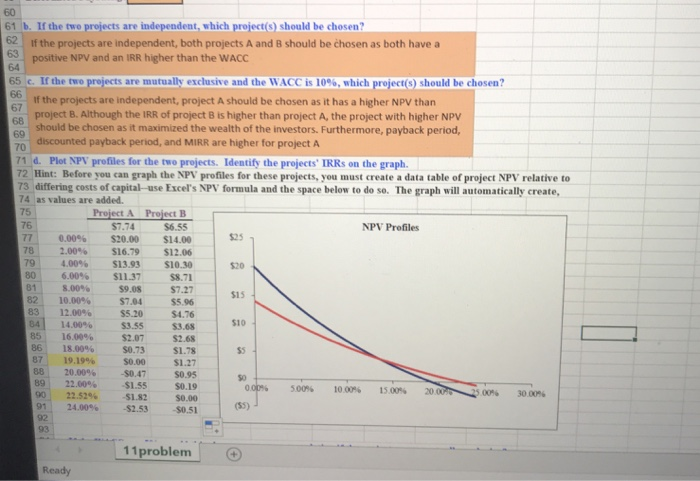
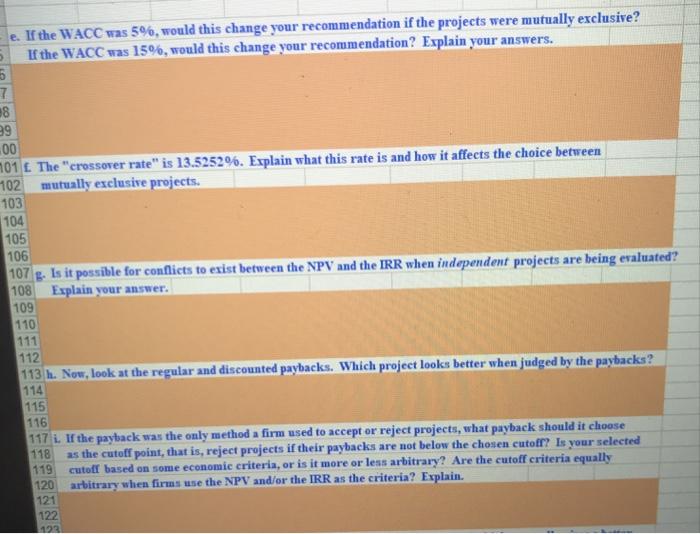
our division is considering two projects. Its WACC is 10%, and the projects after-tax cash flows (in millions of dollars) would be as follows: Expected Cash Flows Time Project A Project B $30) S5 $10 SIS $20 (S30 S20 S10 S8 S6 0 a. Calculate the projects' NPVs, IRRs, MIRRs, regular paybacks, and discounted paybacks. - Use Excel's NPV function as explained in 1lmodel.xlsx. Note that the range does not include the initial costs, which are added separately. 10% $7.74 $6.55 :we find the internal rate of return with Excel's IRR function: IRRA 5 IRRB 19.19% 22.52% 7 we find the modified internal rate of return with Excel's MIRR function using the 10% WACC: 8 MIRRA 16.50% 15.57% Project A Payback Period Time period: Cash flow: Cumulative cash flow: 0 30 30 10 15 15 20 20 25 PaybackA: 3.00 Project B Payback Period Time period: 0 Cash flow: 30 20 10 10 Cumulative cash flow: 30 Paybackp: Project A Discounted Payback Period: 14 2.00 Time period: 0 Cash flow: 30 10 8.26 (17.19) 15 11.27 (5.92) 20 13.66 7.74 Disc. cash flow: 1.00 4.55 (25.45) 9 Disc. cum. cash flow: (30.00 1Discounted PaybackA 3.43 3 Project B Discounted Payback Period Time period: 0 Cash flow 30 20 18.18 (ii,82) 10 8.26 (3.55) 56 Disc. cash flow: Disc. cum, cash flow: 1.00 (30.00) 6.01 4.10 6.55 571 58 59 Discounted Payback:2.59 60 61 b. If the two projects are independent, which project(s) should be chosen? b. If the two projects are independent, which projecto) should be chosen? 62 If the projects are independent, both projects A and 8 should be chosen as both have a positive NPV and an IRR higher than the WACC 65 c. If the two pro ects are mutually exclusive and the WACC is 10%. which proiect s) should be chosen? If the projects are independent, project A should be chosen as it has a higher NPV than project B. Although the IRR of project 8 is higher than project A, the project with higher NPV should be chosen as it maximized the wealth of the investors. Furthermore, payback period discounted payback period, and MIRR are higher for project A 71 d. Plot NPV profiles for the two projects. Identify the projects' IRRs on the graph. 72 Hint: Before you can graph the NPV profiles for these projects, you must create a data table of project NPV relative to 73 differing costs of capital-use Excel's NPV formula and the space below to do so. The graph will automatically create, 4 as values are added. $7.74 $6.55 NPV Profiles $25 77 0.00% S20.00 S14.00 78-2.00% S16.79 $12.06 79-4.00% S13.93 $10.30 80 S8.71 9.08$7.27 82 : 10.00% S7.04 S5.96 83 | 12.00% S5.20 S4.76 841 14.00% $3.55 $3.6S 85| 16.00% S2.07 S2.68 $1.78 871 19.19% s0.00 s1.27 88.20.00% -$0.47 S0.95 $0.19 1.82 50.00 6.00% 8.00% $11.37 81 $15 $10 86 18.00% $0.73 89.22.00% 90 22.52% 91. 24.00% -$L55 -SL82 -S2.53-$0.51 500% 100% 15 00% 20 00% 3000% $0.51 (5) 11problem Ready If the WACC was 5%, would this chan If the WACC was 15%, would this change your recommendation? Explain your answers. ge your recommendation if the projects were mutually exclusive? 8 OIL The "crossover rate" is 13.525296. Explain what this rate is and how it affects the choice between 102 mutually exclusive projects. 103 mutrually exclusive 104 105 106 107g Is it possible for conflicts to exist between the NPV and the IRR when independent projects are being evaluated? 108 Esplain your answer 109 110 112 113 h. 114 115 116 Now, look at the regular and discounted paybacks. Which project looks better when judged by the paybacks? 117 i. If the payback was the only method a firm used to accept or reject projects, what payback should it choose as the cutoff point, that is, reject projects if their paybacks are not below the chosen cutoff? Is your selected 119 cutoff based on some economic criteria, or is it more or less arbitrary? Are the cutoff criteria equally 120 121 as the criteria? Explain. arbitrary when firus use the NPY and/or the IRR 122


