

Answered step by step
Verified Expert Solution
Question
1 Approved Answer
answer fast I up vote Question 2-12 points The following plot depicts cumulative abnormal returns over 36 months following an announcement for firms that initiated
answer fast I up vote
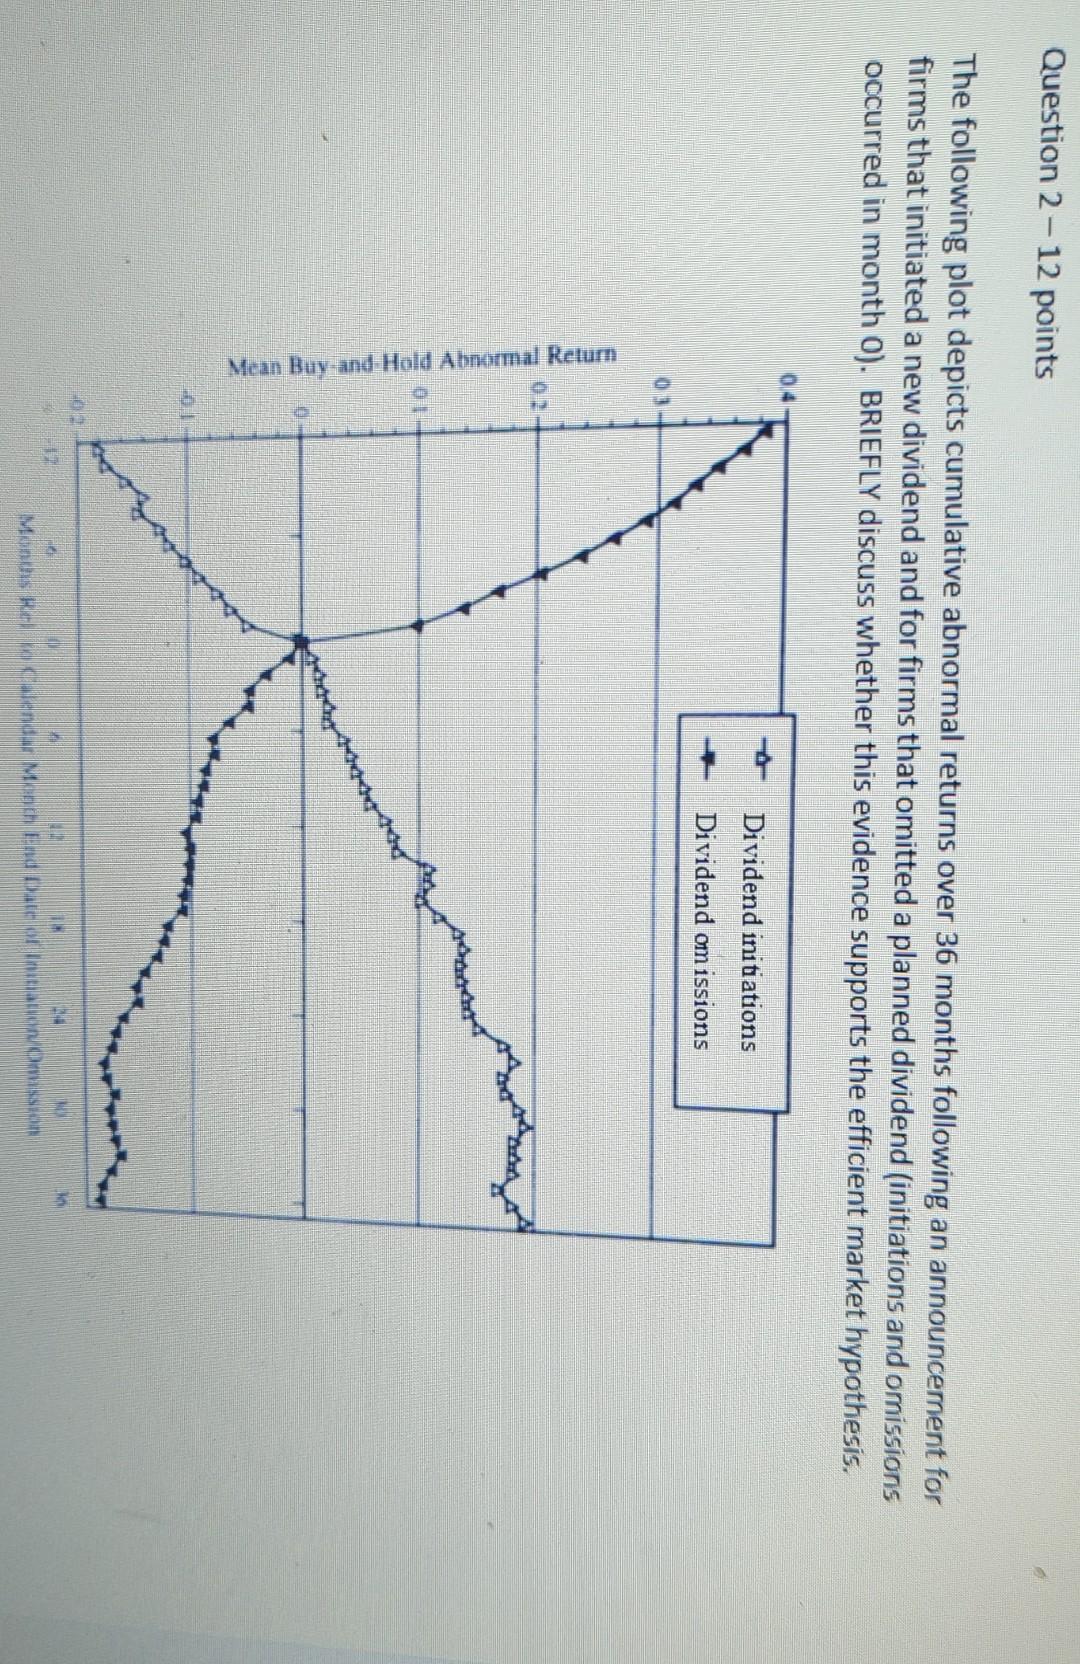
Question 2-12 points The following plot depicts cumulative abnormal returns over 36 months following an announcement for firms that initiated a new dividend and for firms that omitted a planned dividend (initiations and omissions occurred in month 0). BRIEFLY discuss whether this evidence supports the efficient market hypothesis. Dividend initiations Dividend omissions 03 Mean Buy and Hald Abnormal Return Argan Mons Halendar Month Date Son Question 2-12 points The following plot depicts cumulative abnormal returns over 36 months following an announcement for firms that initiated a new dividend and for firms that omitted a planned dividend (initiations and omissions occurred in month 0). BRIEFLY discuss whether this evidence supports the efficient market hypothesis. Dividend initiations Dividend omissions 03 Mean Buy and Hald Abnormal Return Argan Mons Halendar Month Date SonStep by Step Solution
There are 3 Steps involved in it
Step: 1

Get Instant Access to Expert-Tailored Solutions
See step-by-step solutions with expert insights and AI powered tools for academic success
Step: 2

Step: 3
Ace Your Homework with AI
Get the answers you need in no time with our AI-driven, step-by-step assistance
Get Started
Mathematics Of Finance
Authors: Robert Brown, Steve Kopp, Petr Zima
8th Edition
0070876460, 978-0070876460