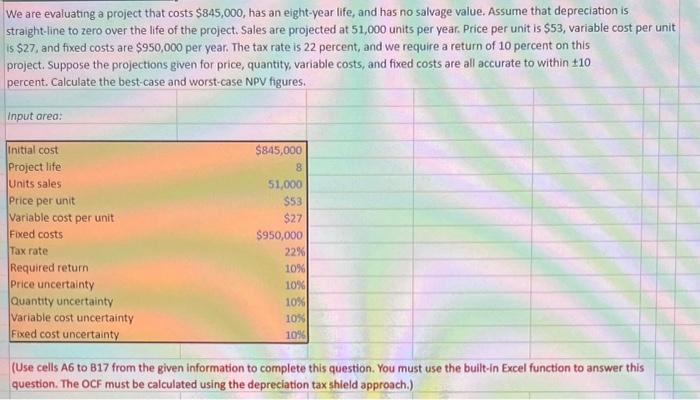
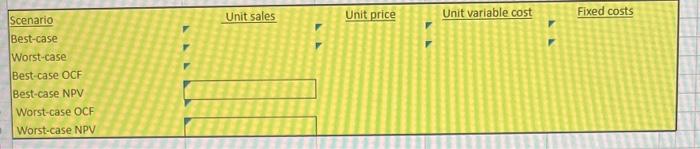
answer in excel formula
We are evaluating a project that costs $845,000, has an eight-year life, and has no salvage value. Assume that depreciation is straight-line to zero over the life of the project. Sales are projected at 51,000 units per year. Price per unit is $53, variable cost per unit is $27, and fixed costs are $950,000 per year. The tax rate is 22 percent, and we require a return of 10 percent on this project. Suppose the projections given for price, quantity, variable costs, and fixed costs are all accurate to within 10 percent. Calculate the best-case and worst-case NPV figures. (Use cells A6 to B17 from the given information to complete this question. You must use the bullt-in Excel function to answer this question. The OCF must be calculated using the depreciation tax shield approach.) \begin{tabular}{|lllll} \hline Scenario \\ Best-case \\ Worst-case \\ Best-case OCF \\ Best-case NPV \\ Worst-case OCF \\ Worst-case NPV \end{tabular} We are evaluating a project that costs $845,000, has an eight-year life, and has no salvage value. Assume that depreciation is straight-line to zero over the life of the project. Sales are projected at 51,000 units per year. Price per unit is $53, variable cost per unit is $27, and fixed costs are $950,000 per year. The tax rate is 22 percent, and we require a return of 10 percent on this project. Suppose the projections given for price, quantity, variable costs, and fixed costs are all accurate to within 10 percent. Calculate the best-case and worst-case NPV figures. (Use cells A6 to B17 from the given information to complete this question. You must use the bullt-in Excel function to answer this question. The OCF must be calculated using the depreciation tax shield approach.) \begin{tabular}{|lllll} \hline Scenario \\ Best-case \\ Worst-case \\ Best-case OCF \\ Best-case NPV \\ Worst-case OCF \\ Worst-case NPV \end{tabular}