

Answered step by step
Verified Expert Solution
Question
1 Approved Answer
Answer in Labview.show block diagram please. ill give thumps up. due in 20 minues sin (n x) Create a vi that graphs N points of
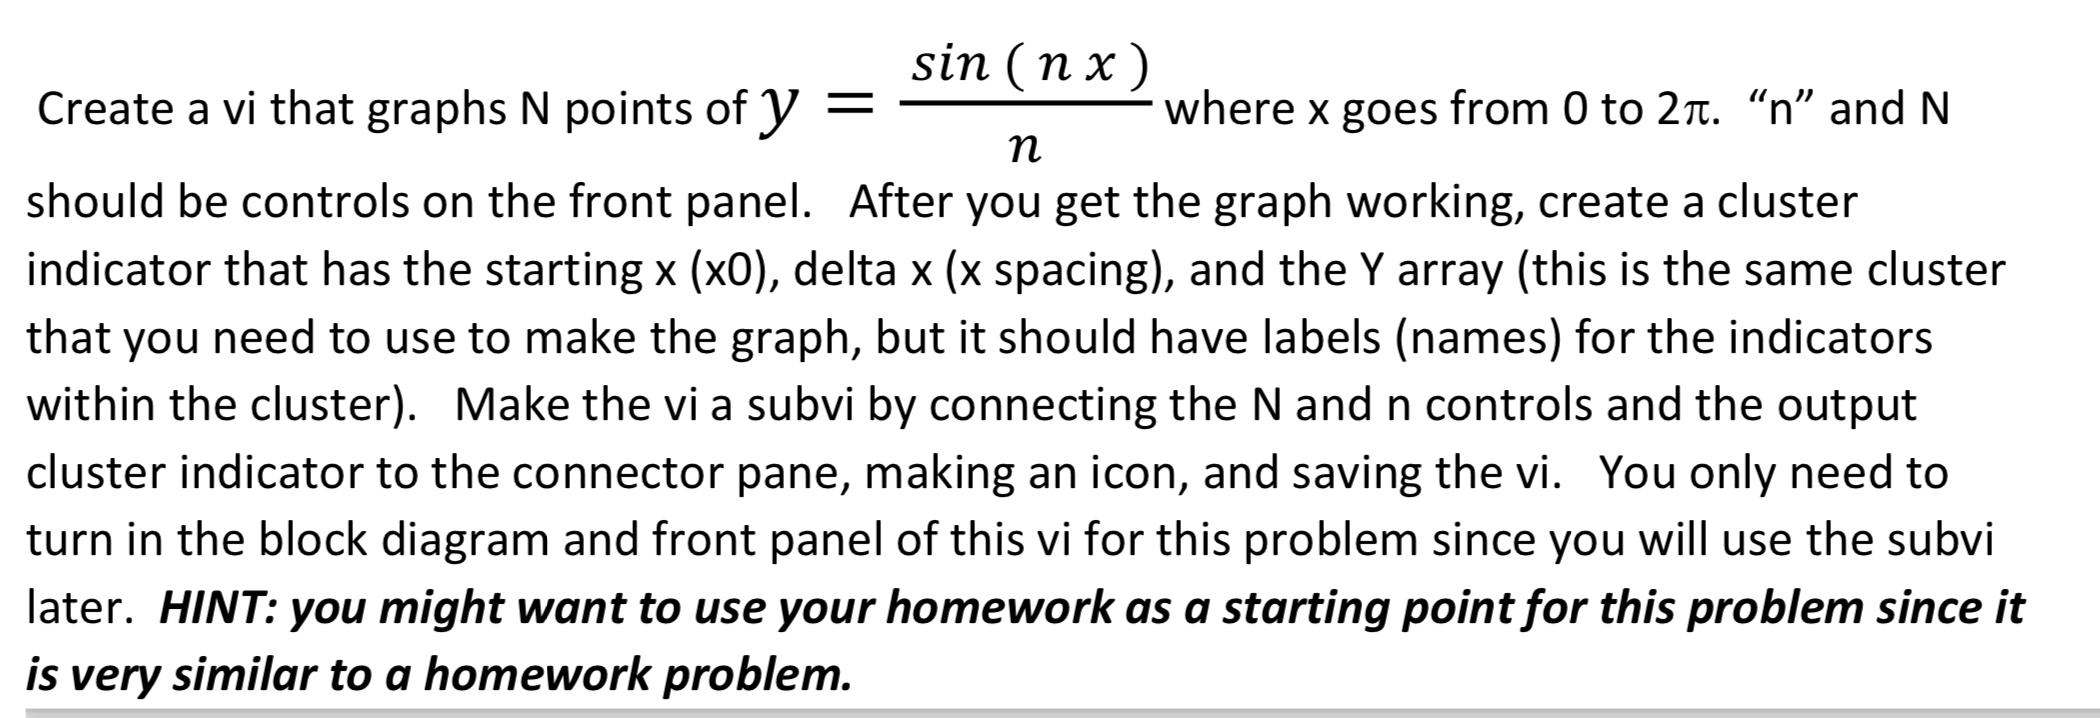
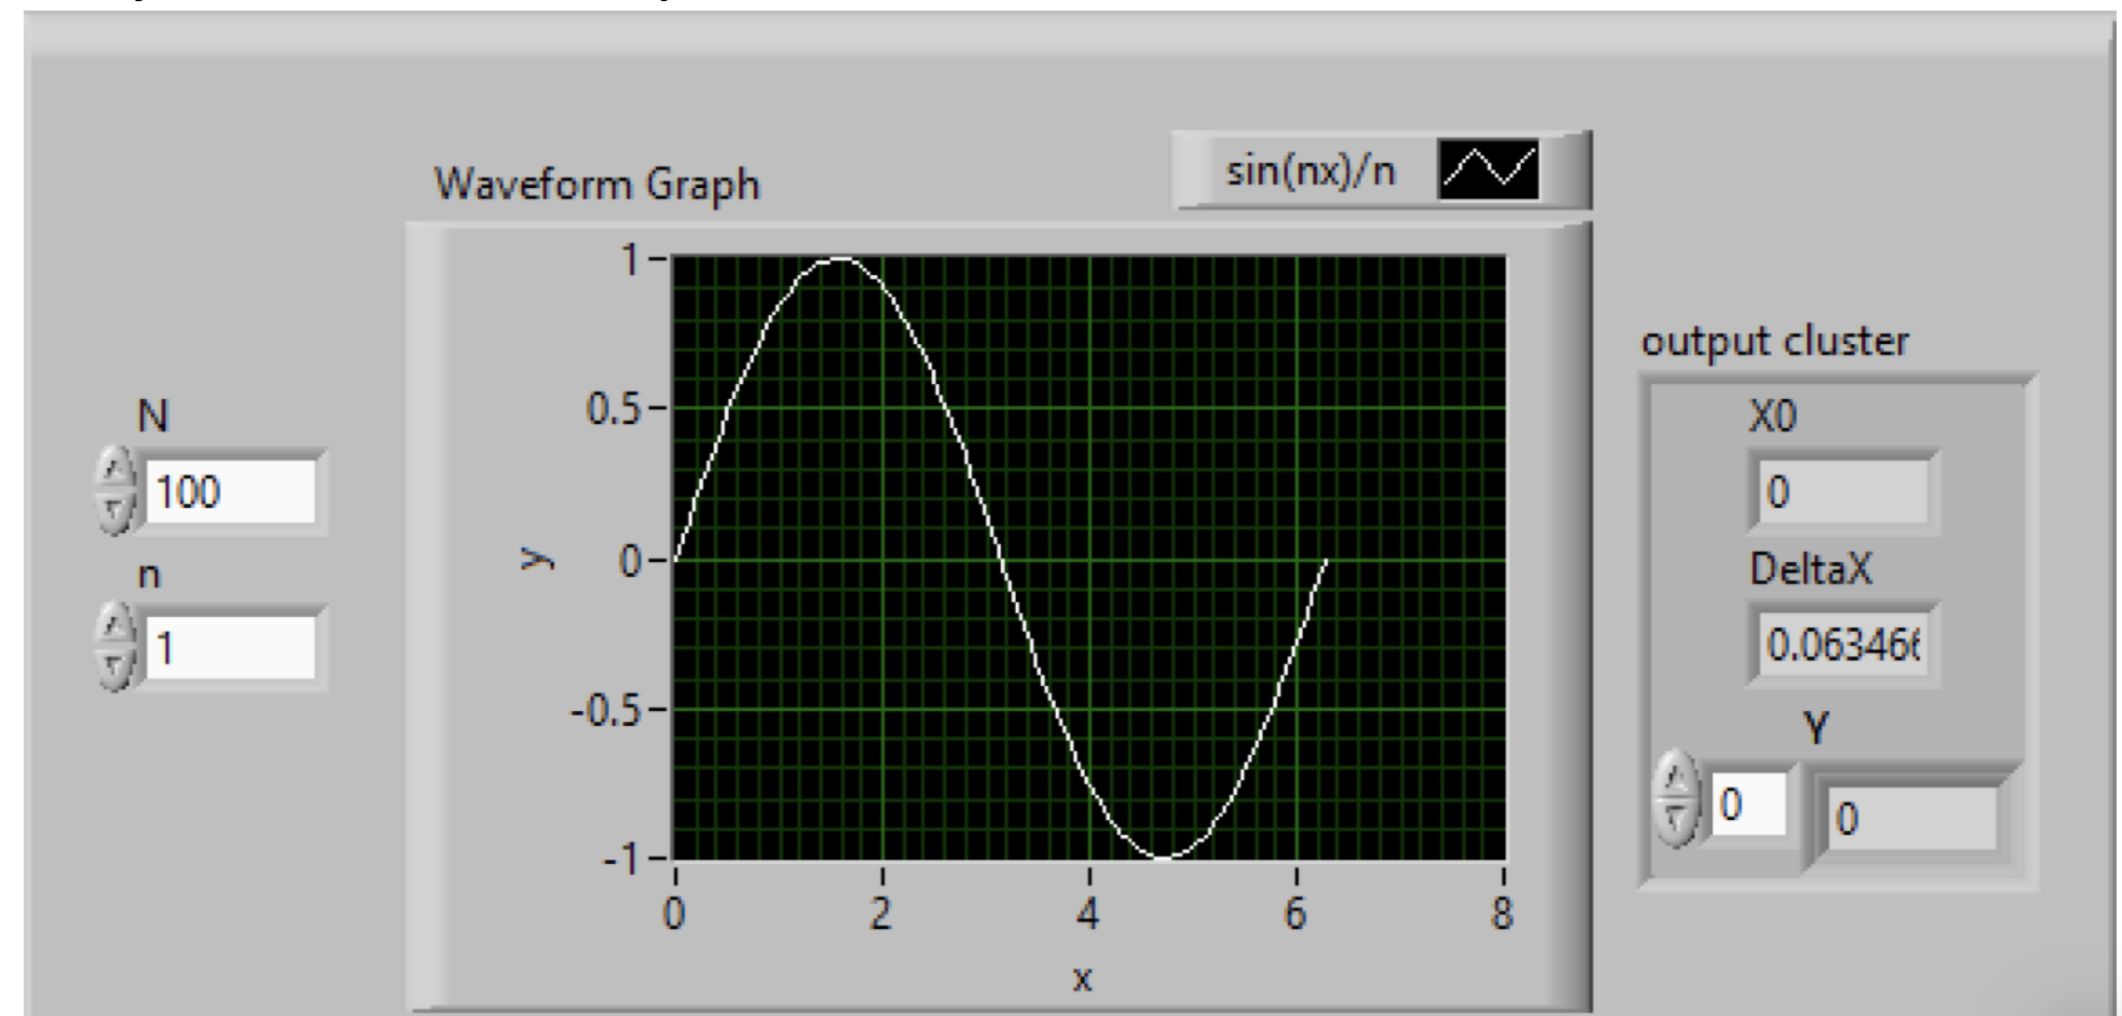 Answer in Labview.show block diagram please. ill give thumps up. due in 20 minues
Step by Step Solution
There are 3 Steps involved in it
Step: 1

Get Instant Access to Expert-Tailored Solutions
See step-by-step solutions with expert insights and AI powered tools for academic success
Step: 2

Step: 3
Ace Your Homework with AI
Get the answers you need in no time with our AI-driven, step-by-step assistance
Get Started
Database Processing Fundamentals Design
Authors: Marion Donnie Dutton Don F. Seaman
14th Edition Globel Edition
1292107634, 978-1292107639