Answer it ASAP in python. Thanks!

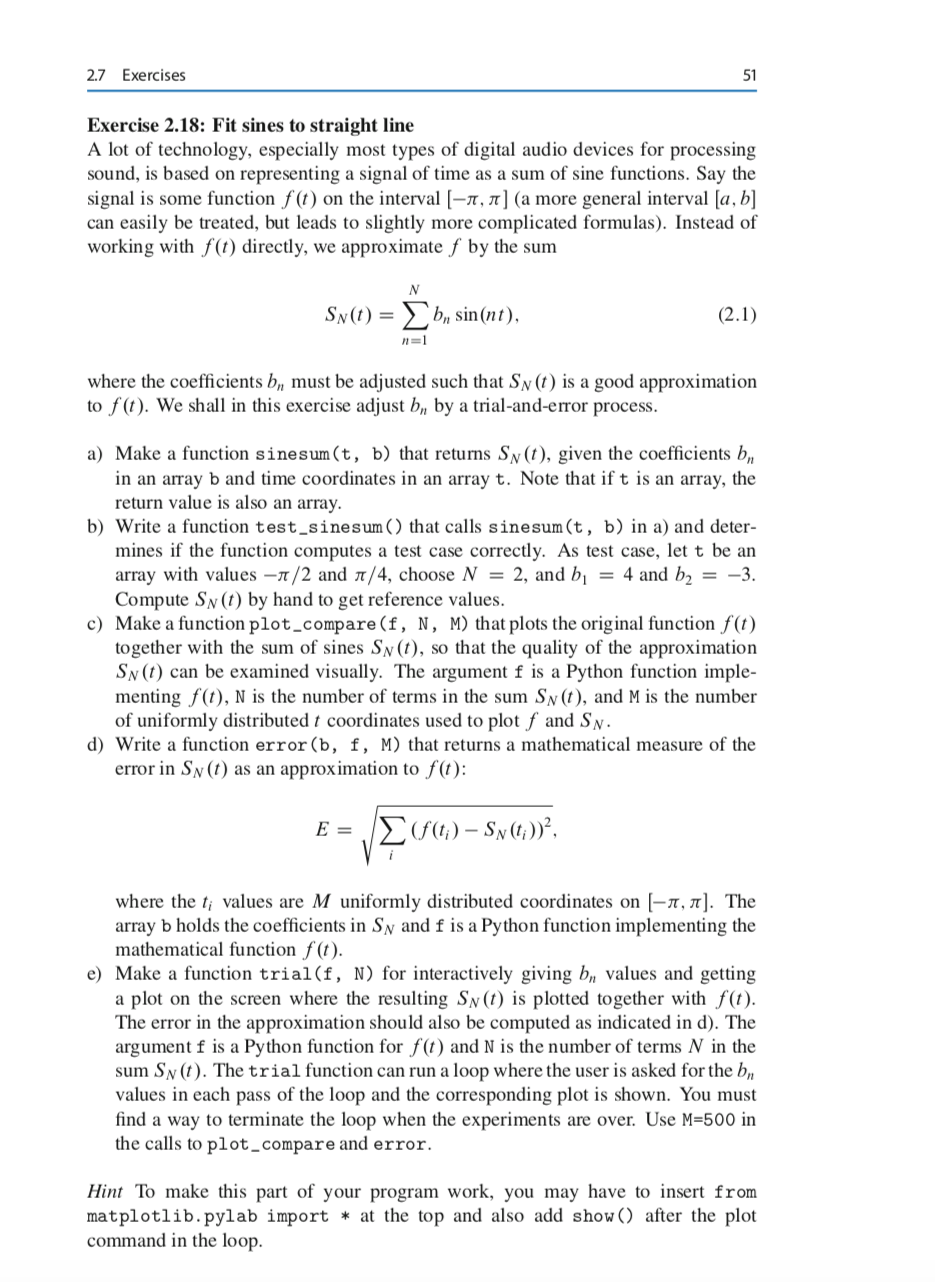
2.7 Exercises 51 Exercise 2.18: Fit sines to straight line A lot of technology, especially most types of digital audio devices for processing sound, is based on representing a signal of time as a sum of sine functions. Say the signal is some function f(t) on the interval (-11, ] (a more general interval [a, b] can easily be treated, but leads to slightly more complicated formulas). Instead of working with f(t) directly, we approximate f by the sum N Sn(t) = b, sin(nt), (2.1) where the coefficients by must be adjusted such that Sy(t) is a good approximation to f(t). We shall in this exercise adjust bn by a trial-and-error process. a) Make a function sinesum(t, b) that returns Sy(t), given the coefficients bn in an array b and time coordinates in an array t. Note that if t is an array, the return value is also an array. b) Write a function test_sinesum () that calls sinesum(t, b) in a) and deter- mines if the function computes a test case correctly. As test case, let t be an array with values -1/2 and 1/4, choose N = 2, and b = 4 and b2 = -3. Compute Sy(t) by hand to get reference values. c) Make a function plot_compare(f, N, M) that plots the original function f(t) together with the sum of sines Sn(t), so that the quality of the approximation Sy(t) can be examined visually. The argument f is a Python function imple- menting f(t), N is the number of terms in the sum Sn(t), and M is the number of uniformly distributed t coordinates used to plot f and Sn. d) Write a function error (b, f, M) that returns a mathematical measure of the error in Sy(t) as an approximation to f(t): E = (f(t;) Sy (t:))?, where the t; values are M uniformly distributed coordinates on (-1,2]. The array b holds the coefficients in Sy and f is a Python function implementing the mathematical function f(t). e) Make a function trial(f, N) for interactively giving b values and getting a plot on the screen where the resulting Sy(t) is plotted together with f(t). The error in the approximation should also be computed as indicated in d). The argument f is a Python function for f(t) and N is the number of terms N in the sum Sy(t). The trial function can run a loop where the user is asked for the bn values in each pass of the loop and the corresponding plot is shown. You must find a way to terminate the loop when the experiments are over. Use M=500 in the calls to plot_compare and error. Hint To make this part of your program work, you may have to insert from matplotlib.pylab import * at the top and also add show() after the plot command in the loop. 2.7 Exercises 51 Exercise 2.18: Fit sines to straight line A lot of technology, especially most types of digital audio devices for processing sound, is based on representing a signal of time as a sum of sine functions. Say the signal is some function f(t) on the interval (-11, ] (a more general interval [a, b] can easily be treated, but leads to slightly more complicated formulas). Instead of working with f(t) directly, we approximate f by the sum N Sn(t) = b, sin(nt), (2.1) where the coefficients by must be adjusted such that Sy(t) is a good approximation to f(t). We shall in this exercise adjust bn by a trial-and-error process. a) Make a function sinesum(t, b) that returns Sy(t), given the coefficients bn in an array b and time coordinates in an array t. Note that if t is an array, the return value is also an array. b) Write a function test_sinesum () that calls sinesum(t, b) in a) and deter- mines if the function computes a test case correctly. As test case, let t be an array with values -1/2 and 1/4, choose N = 2, and b = 4 and b2 = -3. Compute Sy(t) by hand to get reference values. c) Make a function plot_compare(f, N, M) that plots the original function f(t) together with the sum of sines Sn(t), so that the quality of the approximation Sy(t) can be examined visually. The argument f is a Python function imple- menting f(t), N is the number of terms in the sum Sn(t), and M is the number of uniformly distributed t coordinates used to plot f and Sn. d) Write a function error (b, f, M) that returns a mathematical measure of the error in Sy(t) as an approximation to f(t): E = (f(t;) Sy (t:))?, where the t; values are M uniformly distributed coordinates on (-1,2]. The array b holds the coefficients in Sy and f is a Python function implementing the mathematical function f(t). e) Make a function trial(f, N) for interactively giving b values and getting a plot on the screen where the resulting Sy(t) is plotted together with f(t). The error in the approximation should also be computed as indicated in d). The argument f is a Python function for f(t) and N is the number of terms N in the sum Sy(t). The trial function can run a loop where the user is asked for the bn values in each pass of the loop and the corresponding plot is shown. You must find a way to terminate the loop when the experiments are over. Use M=500 in the calls to plot_compare and error. Hint To make this part of your program work, you may have to insert from matplotlib.pylab import * at the top and also add show() after the plot command in the loop


