Question
1. Based on the information in the company's most recent annual report, determine each of the following: a. Gross profit for each year reported. b.
1. Based on the information in the company's most recent annual report, determine each of the following:
a. Gross profit for each year reported.
b. Gross profit rate (Gross profit / Sales) for each year reported. Round to one decimal place.
c. Operating income for each year reported.
d. Percentage change in operating income for the most recent year. Round to one decimal place.
e. Net income for each year reported.
f. Percentage change in net income for the most recent year. Round to one decimal place.
2. Based solely on your responses to Item 1, has the company's performance improved, remained constant, or deteriorated over the periods presented? Briefly explain your answer.


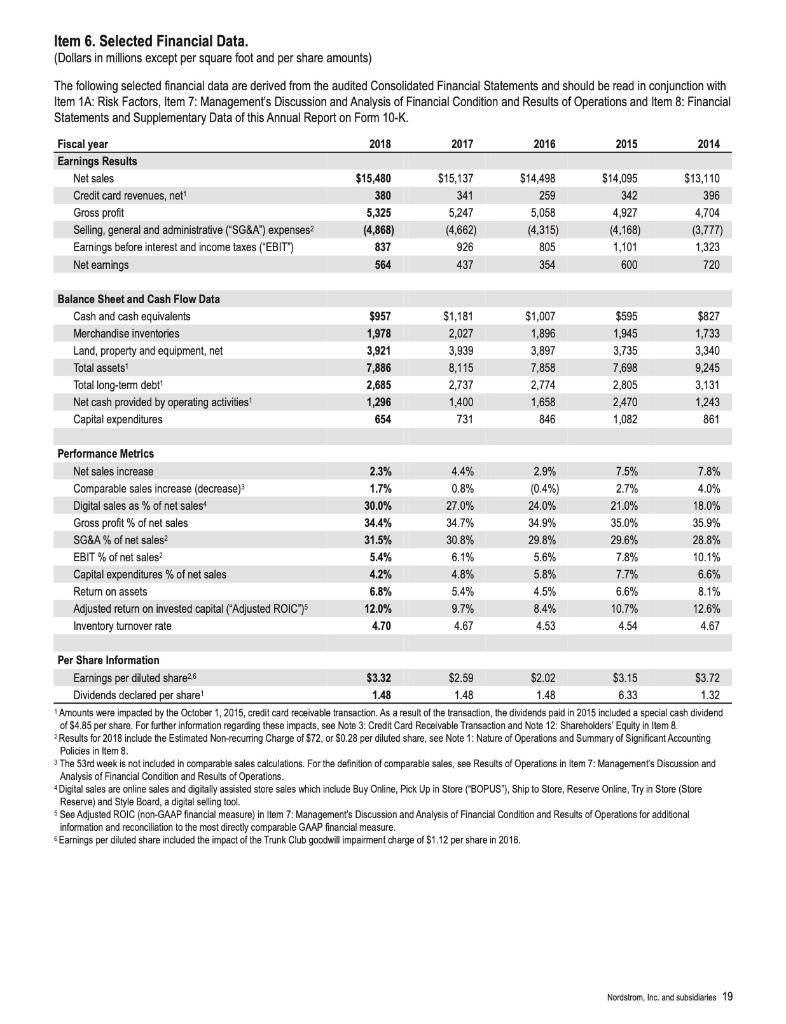
Item 6. Selected Financial Data. (Dollars in millions except per square foot and per share amounts) The following selected financial data are derived from the audited Consolidated Financial Statements and should be read in conjunction with Item 1A: Risk Factors, Item 7: Management's Discussion and Analysis of Financial Condition and Results of Operations and Item 8: Financial Statements and Supplementary Data of this Annual Report on Form 10-K. 2016 Fiscal year Earnings Results 2018 2017 2015 2014 Net sales $15,480 $15,137 $14,498 $14,095 $13,110 Credit card revenues, net' 380 341 259 342 396 Gross profit 5,325 5,247 5,058 4,927 4,704 (3,777) 1,323 Selling, general and administrative ("SG&A") expenses? (4,868) (4,662) (4,315) (4,168) Earnings before interest and income taxes ("EBIT") 837 926 805 1,101 Net earnings 564 437 354 600 720 Balance Sheet and Cash Flow Data Cash and cash equivalents $957 $1,181 $1,007 $595 $827 Merchandise inventories 1,978 2,027 1,896 1,945 1,733 3,735 3,340 Land, property and equipment, net Total assets Total long-term debt Net cash provided by operating activities Capital expenditures 3,921 3,939 3,897 7,886 8,115 7,858 7,698 9,245 2,685 2,737 2,774 2,805 3,131 1,296 1,400 1,658 2,470 1,243 654 731 846 1,082 861 Performance Metrics Net sales increase 2.3% 4.4% 2.9% 7.5% 7.8% Comparable sales increase (decrease) Digital sales as % of net sales Gross profit % of net sales 1.7% 0.8% (0.4%) 2.7% 4.0% 30.0% 27.0% 24.0% 21.0% 18.0% 34.4% 34.7% 34.9% 35.0% 35.9% SG&A % of net sales? 31.5% 30.8% 29.8% 29.6% 28.8% EBIT % of net sales 5.4% 6.1% 5.6% 7.8% 10.1% Capital expenditures % of net sales 4.2% 4.8% 5.8% 7.7% 6.6% Return on assets 6.8% 5.4% 4.5% 6.6% 8.1% Adjusted return on invested capital ("Adjusted ROIC")S 12.0% 9.7% 8.4% 10.7% 12.6% Inventory turnover rate 4.70 4.67 4.53 4.54 4.67 Per Share Information Earnings per diluted share26 $3.32 $2.59 $2.02 $3.15 $3.72 Dividends declared per share! 1.48 1.48 1.48 6.33 1.32 1 Amounts were impacled by the October 1, 2015, credit card receivable transaction. As a result of the transaction, the dividends paid in 2015 included a special cash dividend of $4.85 per share. For further informatian regarding these impacts, see Note 3: Credit Card Receivable Transaction and Note 12: Shareholders' Equity in Item 8. Results for 2018 include the Estimated Non-recurring Charge of $72, or $0.28 per diluted share, see Note 1: Nature of Operations and Summary of Significant Accounting Policies in Item 8. 3 The 53rd week is not included in comparable sales calculations. For the definition of comparable sales, see Results of Operations in item 7: Management's Discussion and Analysis of Financial Condition and Results of Operations. 4 Digital sales are online sales and digitally assisted store sales which include Buy Online, Pick Up in Store ("BOPUS"), Ship to Store, Reserve Online, Try in Store (Store Reserve) and Style Board, a digital selling tool. 5 See Adjusted ROIC (non-GAAP financial measure) in item 7: Management's Discussion and Analysis of Financial Condition and Results of Operations information and reconciliation to the most directly comparable GAAP financial measure. Earnings per diluted share included the impact of the Trunk Club goodwill impaiment charge of $1.12 per share in 2016. additional Nordstrom, Inc, and subsidiaries 19
Step by Step Solution
3.44 Rating (151 Votes )
There are 3 Steps involved in it
Step: 1
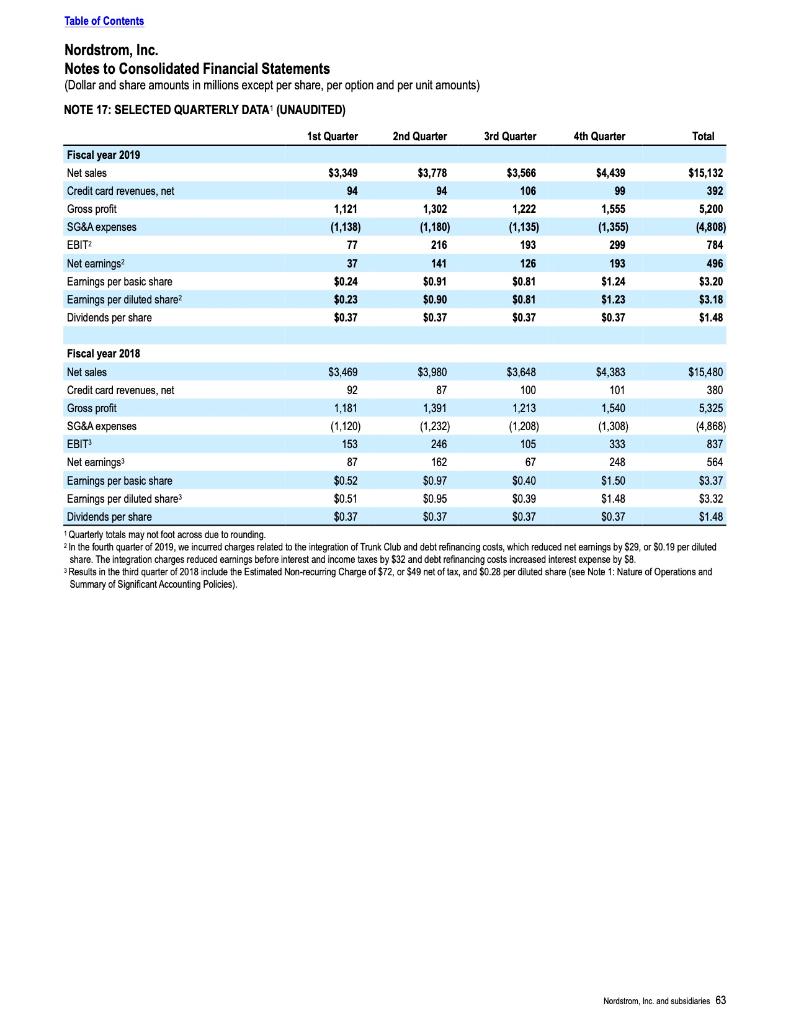
Dollar in millions 2019 2018 2017 2016 2015 2014 a Gross profit 5200 532...
Get Instant Access to Expert-Tailored Solutions
See step-by-step solutions with expert insights and AI powered tools for academic success
Step: 2

Step: 3

Ace Your Homework with AI
Get the answers you need in no time with our AI-driven, step-by-step assistance
Get Started


