ANSWER N MATLAB CODE PLEASE. DO NOT CALCULATE BY HAND. THANK YOU. 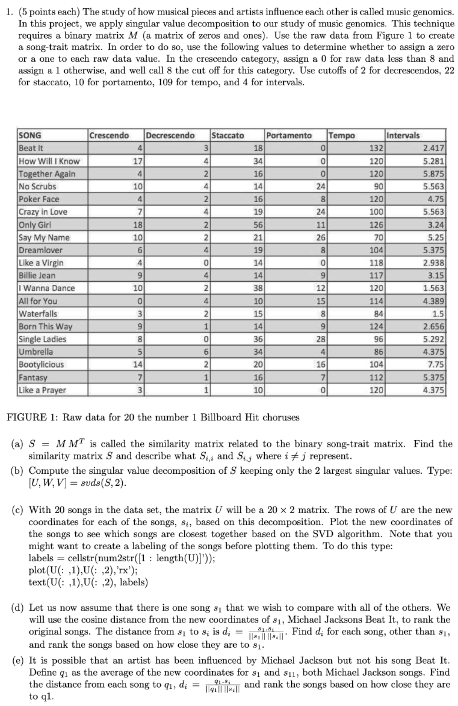
1. (5 points each) The study of how musical pieces and artists influence each other is called music genomics. In this project, we apply singular value decomposition to our study of music genomics. This technique requires a binary matrix M (a matrix of zeros and ones). Use the raw data from Figure 1 to create a song-trait matrix. In order to do so, use the following values to determine whether to assign a zero or a one to each raw data value. In the crescendo category, assign a 0 for raw data less than 8 and ussign a 1 otherwise, and well cull 8 the cut off for this category. Use cutoffs of 2 for decrescendos, 22 for staccato, 10 for portamento, 109 for tempo, and 4 for intervals. FIGURE 1: Raw data for 20 the number 1 Billboard Hit choruses (a) S=MMT is called the similarity matrix related to the binary song-trait matrix. Find the similarity matrix S and describe what Si,j and Si,j where i=j represent. (b) Compute the singular value decomposition of S keeping only the 2 largest singular values. Type: [U,W,V]=seds(S,2) (c) With 20 songs in the data set, the matrix U will be a 202 matrix. The rows of U are the new coordinates for each of the songs, si, based on this decomposition. Plot the new coordinates of the songs to see which songs are closest together based on the SVD algorithm. Note that you might want to create a labeling of the songs before plotting them. To do this type: labels = cellstr(num2str([1 : length (U)]])); plot(U(: , 1), U(:,2),rx '); text(U(=,1),U(=,2), labels) (d) Let us now assume that there is one song s1 that we wish to compare with all of the others. We will use the cosine distance from the new coordinates of s1, Michael Jacksons Beat It, to rank the original songs. The distance from s1 to si is di=xnsis1,si. Find di for eich song, other than s1, and rank the songs based on how close they are to s1. (e) It is possible that an artist has been influenoed by Michael Jackson but not his song Beat It. Define q1 as the average of the new coordinates for s1 and s11, both Michael Jeckson songs. Find the distanoe from each song to q1,di=q1xiq1xi and rank the songs based on how close they are to q1. 1. (5 points each) The study of how musical pieces and artists influence each other is called music genomics. In this project, we apply singular value decomposition to our study of music genomics. This technique requires a binary matrix M (a matrix of zeros and ones). Use the raw data from Figure 1 to create a song-trait matrix. In order to do so, use the following values to determine whether to assign a zero or a one to each raw data value. In the crescendo category, assign a 0 for raw data less than 8 and ussign a 1 otherwise, and well cull 8 the cut off for this category. Use cutoffs of 2 for decrescendos, 22 for staccato, 10 for portamento, 109 for tempo, and 4 for intervals. FIGURE 1: Raw data for 20 the number 1 Billboard Hit choruses (a) S=MMT is called the similarity matrix related to the binary song-trait matrix. Find the similarity matrix S and describe what Si,j and Si,j where i=j represent. (b) Compute the singular value decomposition of S keeping only the 2 largest singular values. Type: [U,W,V]=seds(S,2) (c) With 20 songs in the data set, the matrix U will be a 202 matrix. The rows of U are the new coordinates for each of the songs, si, based on this decomposition. Plot the new coordinates of the songs to see which songs are closest together based on the SVD algorithm. Note that you might want to create a labeling of the songs before plotting them. To do this type: labels = cellstr(num2str([1 : length (U)]])); plot(U(: , 1), U(:,2),rx '); text(U(=,1),U(=,2), labels) (d) Let us now assume that there is one song s1 that we wish to compare with all of the others. We will use the cosine distance from the new coordinates of s1, Michael Jacksons Beat It, to rank the original songs. The distance from s1 to si is di=xnsis1,si. Find di for eich song, other than s1, and rank the songs based on how close they are to s1. (e) It is possible that an artist has been influenoed by Michael Jackson but not his song Beat It. Define q1 as the average of the new coordinates for s1 and s11, both Michael Jeckson songs. Find the distanoe from each song to q1,di=q1xiq1xi and rank the songs based on how close they are to q1