Question
Answer Needed: Total Profit = Total amount spent on ads- Total Revenue of ads ROAS= Total Revenue / Ads Spent 21. Which platform had the
Answer Needed:
Total Profit = Total amount spent on ads- Total Revenue of ads
ROAS= Total Revenue / Ads Spent
| 21. Which platform had the highest total profit? What was it? | |||
| 22. Which platform had the lowest total profit? What was it? | |||
| 23. Which day of the week had the highest total profit? What was it? | |||
| 24. Which day of the week had the lowest total profit? What was it? | |||
| 25. Which Platform had the highest Profit per Transaction? What was it? | |||
| 26. Which Platform had the lowest Profit per Transaction? What was it? | |||
| 27. Which day of the week had the highest Profit per Transaction? What was it? | |||
| 28. Which day of the week had the lowest Profit per Transaction? What was it? | |||
| 29. Which platform had the highest ROAS (Revenue)? What was it? | |||
| 30. Which platform had the lowest ROAS (Revenue)? What was it? | |||
| 31. Which platform had the highest ROAS (Profit)? What was it? | |||
| 32. Which platform had the lowest ROAS (Profit)? What was it? | |||
Context (Need You to Verify Accuracy):
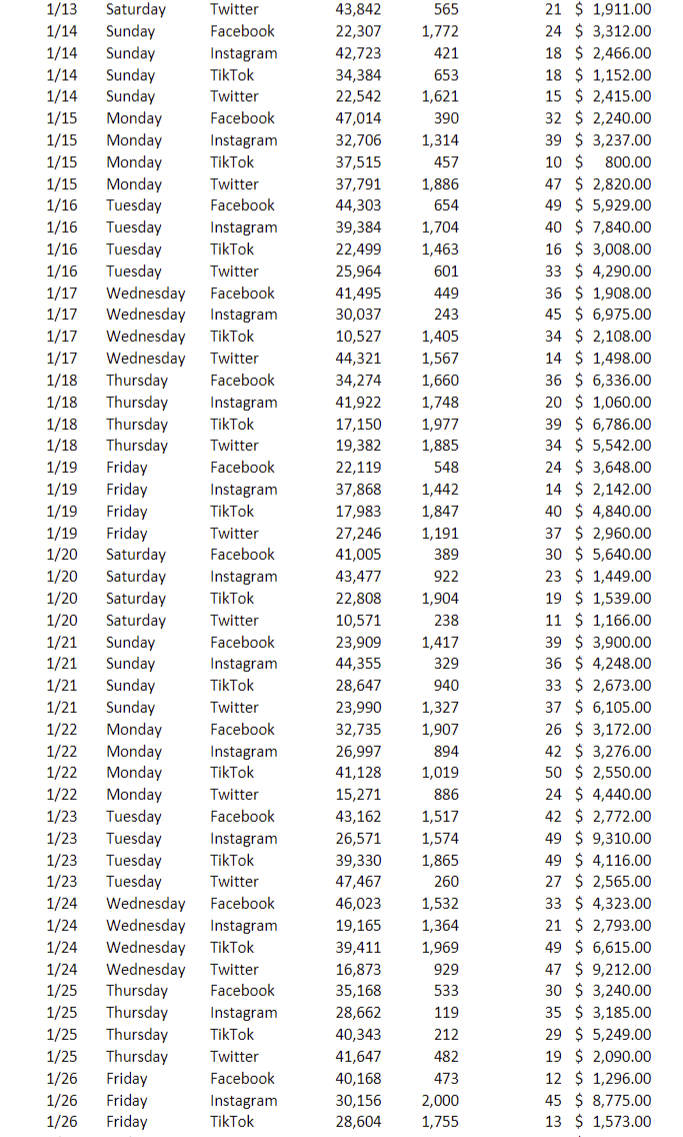
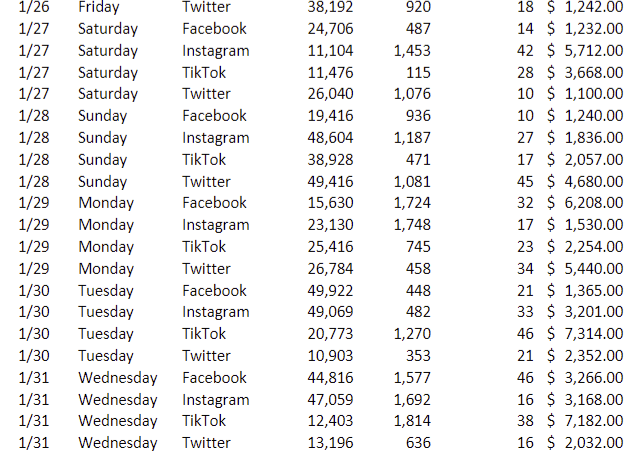
Original Data (text form):
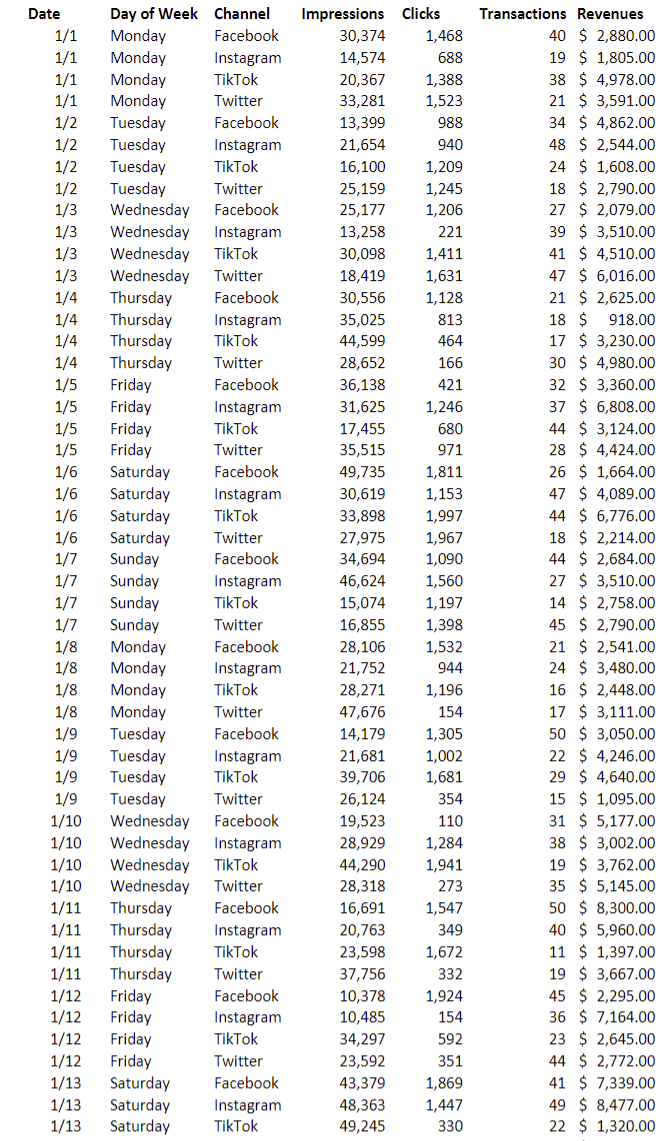
Date Day of Week Channel Impressions Clicks Transactions Revenues 1/1 Monday Facebook 30,374 1,468 40 $ 2,880.00 1/1 Monday Instagram 14,574 688 19 $ 1,805.00 1/1 Monday TikTok 20,367 1,388 38 $ 4,978.00 1/1 Monday Twitter 33,281 1,523 21 $ 3,591.00 1/2 Tuesday Facebook 13,399 988 34 $ 4,862.00 1/2 Tuesday Instagram 21,654 940 48 $ 2,544.00 1/2 Tuesday TikTok 16,100 1,209 24 $ 1,608.00 1/2 Tuesday Twitter 25,159 1,245 18 $ 2,790.00 1/3 Wednesday Facebook 25,177 1,206 27 $ 2,079.00 1/3 Wednesday Instagram 13,258 221 39 $ 3,510.00 1/3 Wednesday TikTok 30,098 1,411 41 $ 4,510.00 1/3 Wednesday Twitter 18,419 1,631 47 $ 6,016.00 1/4 Thursday Facebook 30,556 1,128 21 $ 2,625.00 1/4 Thursday Instagram 35,025 813 18 $ 918.00 1/4 Thursday TikTok 44,599 464 17 $ 3,230.00 1/4 Thursday Twitter 28,652 166 30 $ 4,980.00 1/5 Friday Facebook 36,138 421 32 $ 3,360.00 1/5 Friday Instagram 31,625 1,246 37 $ 6,808.00 1/5 Friday TikTok 17,455 680 44 $ 3,124.00 1/5 Friday Twitter 35,515 971 28 $ 4,424.00 1/6 Saturday Facebook 49,735 1,811 26 $ 1,664.00 1/6 Saturday Instagram 30,619 1,153 47 $ 4,089.00 1/6 Saturday TikTok 33,898 1,997 44 $ 6,776.00 1/6 Saturday Twitter 27,975 1,967 18 $ 2,214.00 1/7 Sunday Facebook 34,694 1,090 44 $ 2,684.00 1/7 Sunday Instagram 46,624 1,560 27 $ 3,510.00 1/7 Sunday TikTok 15,074 1,197 14 $ 2,758.00 1/7 Sunday Twitter 16,855 1,398 45 $ 2,790.00 1/8 Monday Facebook 28,106 1,532 21 $ 2,541.00 1/8 Monday Instagram 21,752 944 24 $ 3,480.00 1/8 Monday TikTok 28,271 1,196 16 $ 2,448.00 1/8 Monday Twitter 47,676 154 17 $ 3,111.00 1/9 Tuesday Facebook 14,179 1,305 50 $ 3,050.00 1/9 Tuesday Instagram 21,681 1,002 22 $ 4,246.00 1/9 Tuesday TikTok 39,706 1,681 29 $ 4,640.00 1/9 Tuesday Twitter 26,124 354 15 $ 1,095.00 1/10 Wednesday Facebook 19,523 110 31 $ 5,177.00 1/10 Wednesday Instagram 28,929 1,284 38 $ 3,002.00 1/10 Wednesday TikTok 44,290 1,941 19 $ 3,762.00 1/10 Wednesday Twitter 28,318 273 35 $ 5,145.00 1/11 Thursday Facebook 16,691 1,547 50 $ 8,300.00 1/11 Thursday Instagram 20,763 349 40 $ 5,960.00 1/11 Thursday TikTok 23,598 1,672 11 $ 1,397.00 1/11 Thursday Twitter 37,756 332 19 $ 3,667.00 1/12 Friday Facebook 10,378 1,924 45 $ 2,295.00 1/12 Friday Instagram 10,485 154 36 $ 7,164.00 1/12 Friday TikTok 34,297 592 23 $ 2,645.00 1/12 Friday Twitter 23,592 351 44 $ 2,772.00 1/13 Saturday Facebook 43,379 1,869 41 $ 7,339.00 1/13 Saturday Instagram 48,363 1,447 49 $ 8,477.00 1/13 Saturday TikTok 49,245 330 22 $ 1,320.00 1/13 Saturday Twitter 43,842 565 21 $ 1,911.00 1/14 Sunday Facebook 22,307 1,772 24 $ 3,312.00 1/14 Sunday Instagram 42,723 421 18 $ 2,466.00 1/14 Sunday TikTok 34,384 653 18 $ 1,152.00 1/14 Sunday Twitter 22,542 1,621 15 $ 2,415.00 1/15 Monday Facebook 47,014 390 32 $ 2,240.00 1/15 Monday Instagram 32,706 1,314 39 $ 3,237.00 1/15 Monday TikTok 37,515 457 10 $ 800.00 1/15 Monday Twitter 37,791 1,886 47 $ 2,820.00 1/16 Tuesday Facebook 44,303 654 49 $ 5,929.00 1/16 Tuesday Instagram 39,384 1,704 40 $ 7,840.00 1/16 Tuesday TikTok 22,499 1,463 16 $ 3,008.00 1/16 Tuesday Twitter 25,964 601 33 $ 4,290.00 1/17 Wednesday Facebook 41,495 449 36 $ 1,908.00 1/17 Wednesday Instagram 30,037 243 45 $ 6,975.00 1/17 Wednesday TikTok 10,527 1,405 34 $ 2,108.00 1/17 Wednesday Twitter 44,321 1,567 14 $ 1,498.00 1/18 Thursday Facebook 34,274 1,660 36 $ 6,336.00 1/18 Thursday Instagram 41,922 1,748 20 $ 1,060.00 1/18 Thursday TikTok 17,150 1,977 39 $ 6,786.00 1/18 Thursday Twitter 19,382 1,885 34 $ 5,542.00 1/19 Friday Facebook 22,119 548 24 $ 3,648.00 1/19 Friday Instagram 37,868 1,442 14 $ 2,142.00 1/19 Friday TikTok 17,983 1,847 40 $ 4,840.00 1/19 Friday Twitter 27,246 1,191 37 $ 2,960.00 1/20 Saturday Facebook 41,005 389 30 $ 5,640.00 1/20 Saturday Instagram 43,477 922 23 $ 1,449.00 1/20 Saturday TikTok 22,808 1,904 19 $ 1,539.00 1/20 Saturday Twitter 10,571 238 11 $ 1,166.00 1/21 Sunday Facebook 23,909 1,417 39 $ 3,900.00 1/21 Sunday Instagram 44,355 329 36 $ 4,248.00 1/21 Sunday TikTok 28,647 940 33 $ 2,673.00 1/21 Sunday Twitter 23,990 1,327 37 $ 6,105.00 1/22 Monday Facebook 32,735 1,907 26 $ 3,172.00 1/22 Monday Instagram 26,997 894 42 $ 3,276.00 1/22 Monday TikTok 41,128 1,019 50 $ 2,550.00 1/22 Monday Twitter 15,271 886 24 $ 4,440.00 1/23 Tuesday Facebook 43,162 1,517 42 $ 2,772.00 1/23 Tuesday Instagram 26,571 1,574 49 $ 9,310.00 1/23 Tuesday TikTok 39,330 1,865 49 $ 4,116.00 1/23 Tuesday Twitter 47,467 260 27 $ 2,565.00 1/24 Wednesday Facebook 46,023 1,532 33 $ 4,323.00 1/24 Wednesday Instagram 19,165 1,364 21 $ 2,793.00 1/24 Wednesday TikTok 39,411 1,969 49 $ 6,615.00 1/24 Wednesday Twitter 16,873 929 47 $ 9,212.00 1/25 Thursday Facebook 35,168 533 30 $ 3,240.00 1/25 Thursday Instagram 28,662 119 35 $ 3,185.00 1/25 Thursday TikTok 40,343 212 29 $ 5,249.00 1/25 Thursday Twitter 41,647 482 19 $ 2,090.00 1/26 Friday Facebook 40,168 473 12 $ 1,296.00 1/26 Friday Instagram 30,156 2,000 45 $ 8,775.00 1/26 Friday TikTok 28,604 1,755 13 $ 1,573.00 1/26 Friday Twitter 38,192 920 18 $ 1,242.00 1/27 Saturday Facebook 24,706 487 14 $ 1,232.00 1/27 Saturday Instagram 11,104 1,453 42 $ 5,712.00 1/27 Saturday TikTok 11,476 115 28 $ 3,668.00 1/27 Saturday Twitter 26,040 1,076 10 $ 1,100.00 1/28 Sunday Facebook 19,416 936 10 $ 1,240.00 1/28 Sunday Instagram 48,604 1,187 27 $ 1,836.00 1/28 Sunday TikTok 38,928 471 17 $ 2,057.00 1/28 Sunday Twitter 49,416 1,081 45 $ 4,680.00 1/29 Monday Facebook 15,630 1,724 32 $ 6,208.00 1/29 Monday Instagram 23,130 1,748 17 $ 1,530.00 1/29 Monday TikTok 25,416 745 23 $ 2,254.00 1/29 Monday Twitter 26,784 458 34 $ 5,440.00 1/30 Tuesday Facebook 49,922 448 21 $ 1,365.00 1/30 Tuesday Instagram 49,069 482 33 $ 3,201.00 1/30 Tuesday TikTok 20,773 1,270 46 $ 7,314.00 1/30 Tuesday Twitter 10,903 353 21 $ 2,352.00 1/31 Wednesday Facebook 44,816 1,577 46 $ 3,266.00 1/31 Wednesday Instagram 47,059 1,692 16 $ 3,168.00 1/31 Wednesday TikTok 12,403 1,814 38 $ 7,182.00 1/31 Wednesday Twitter 13,196 636 16 $ 2,032.00
Image of same data:
Additional Context:
- Online sales earn a 12% profit margin.
- Your monthly social media advertising budget is $20,000
- You currently allocate 30% to Facebook, 30% to Instagram, 20% to TikTok, and 20% to Twitter. (This is the 3rd bullet point, useful for calculating CTR?)
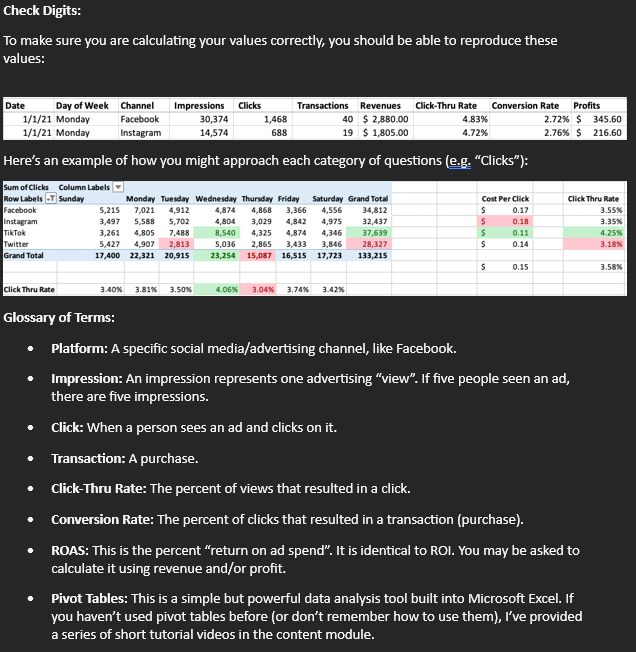
"Click thru rate is defined and you'll need to calculate it. Also, you should be able to determine the total cost and the totals clicks, so you can calculate cost per click."
"The student stated that they got CTR by dividing total sum of click by total sum of impressions for each channel and did it for each day of the week. This is the right way to do this. You have to view the ad (impression) before you can click. Cost-per-click is similar in that you have to divide the cost per the click. Cost is given in the third bullet point of the assignment."
That's all the info I physically have.
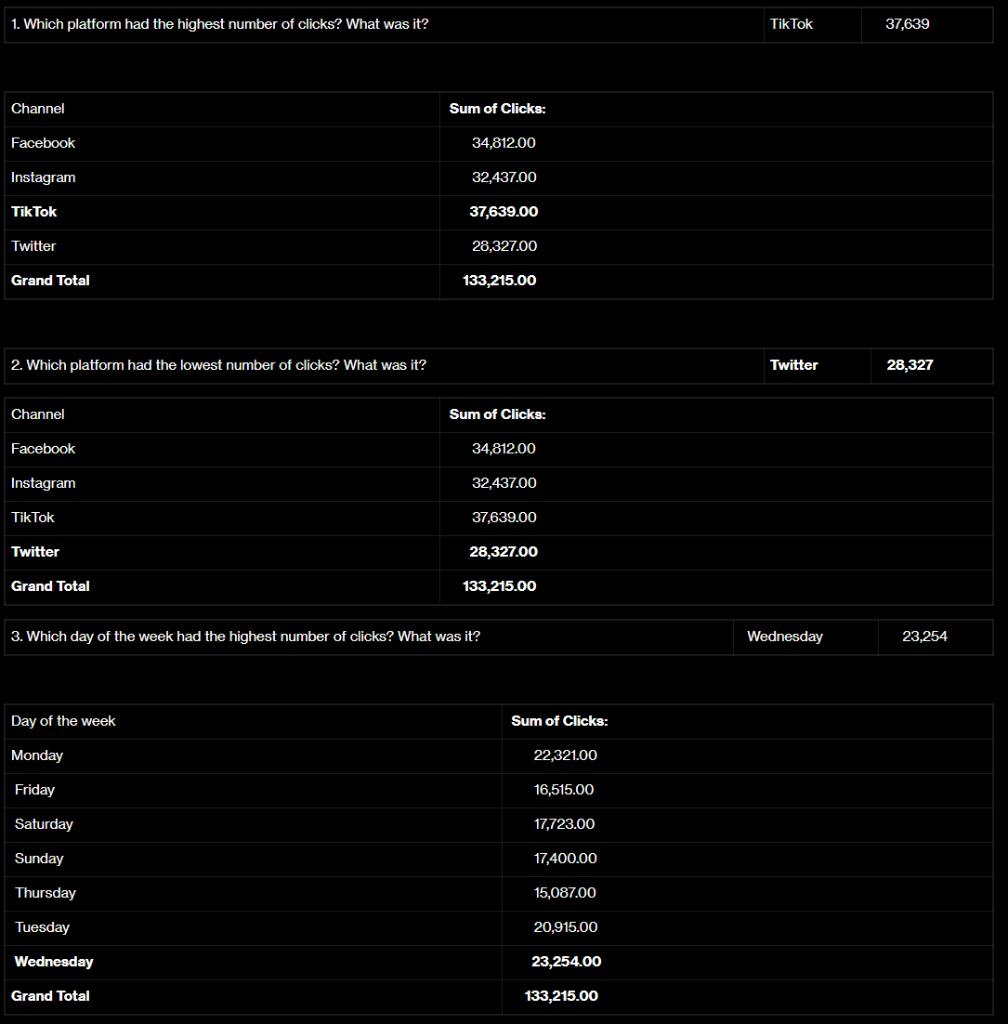
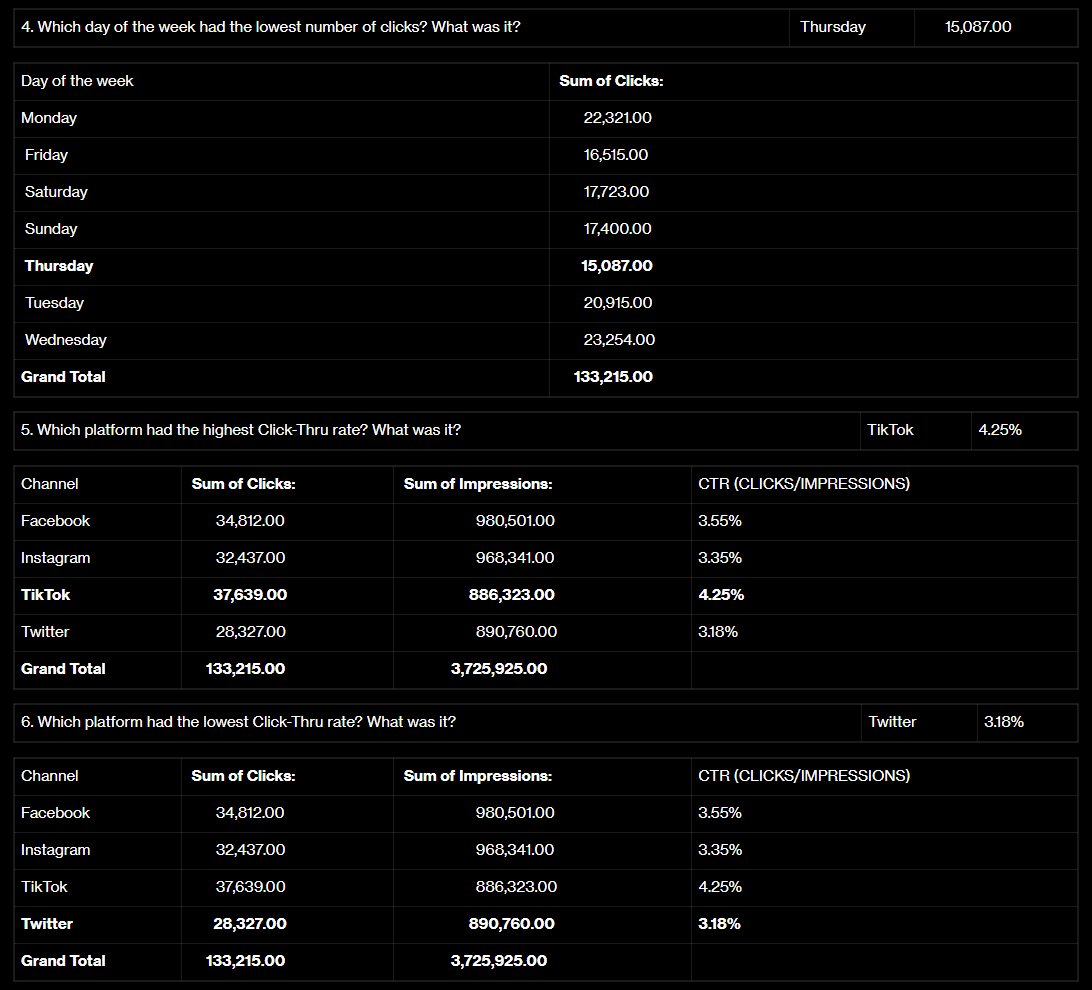
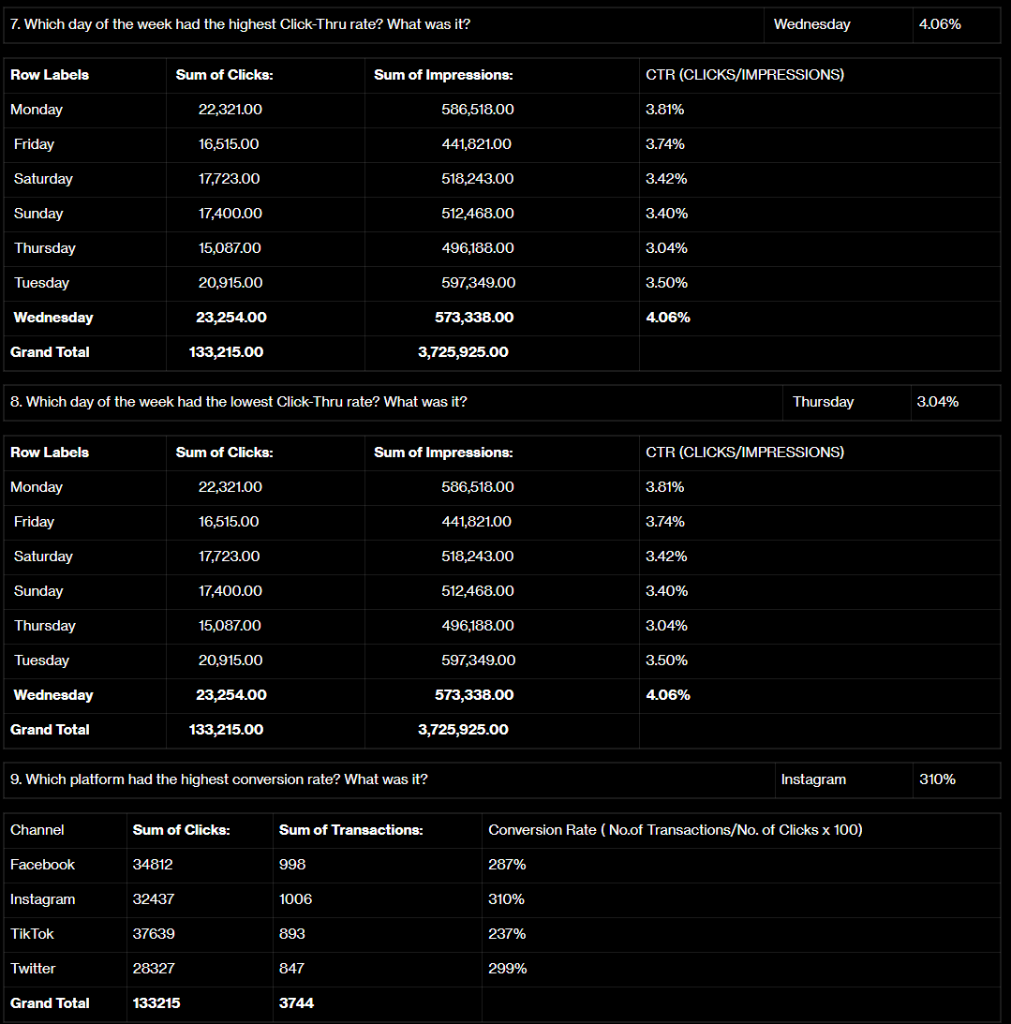
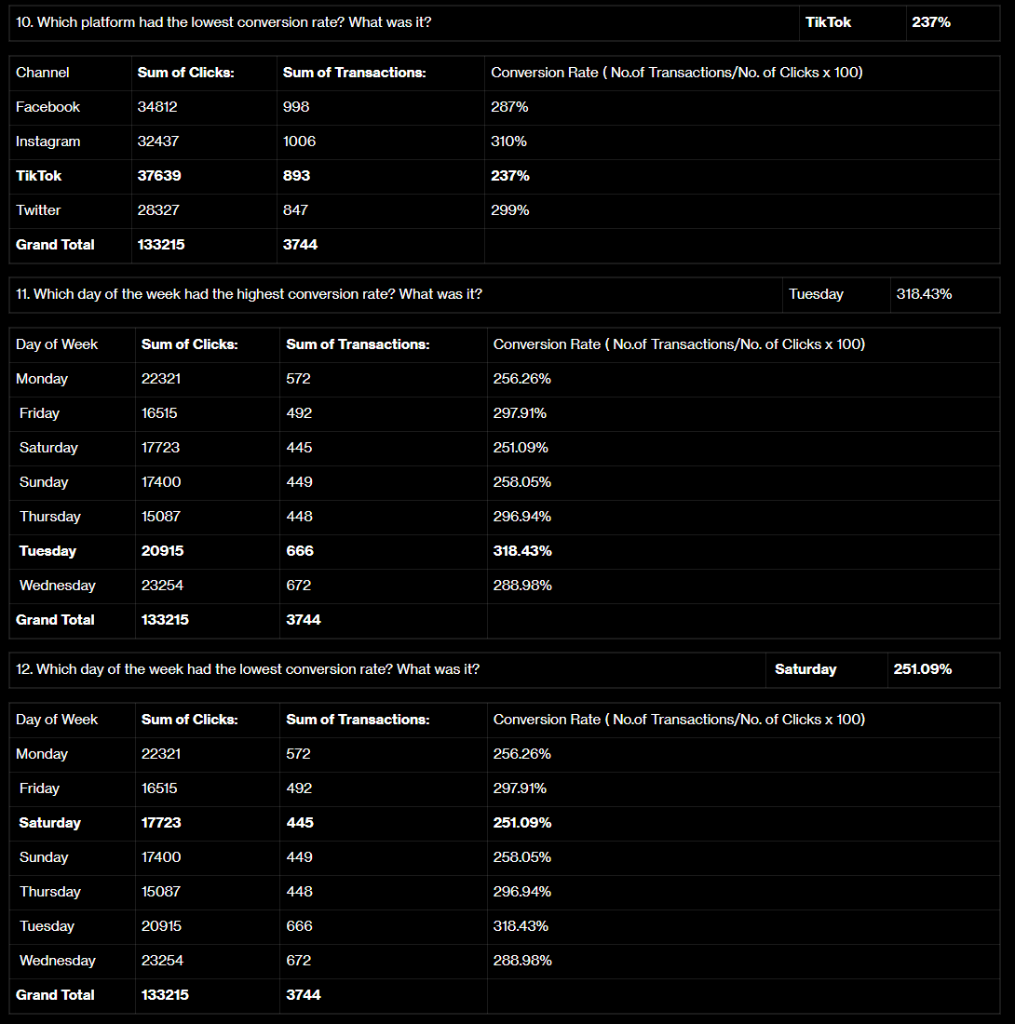
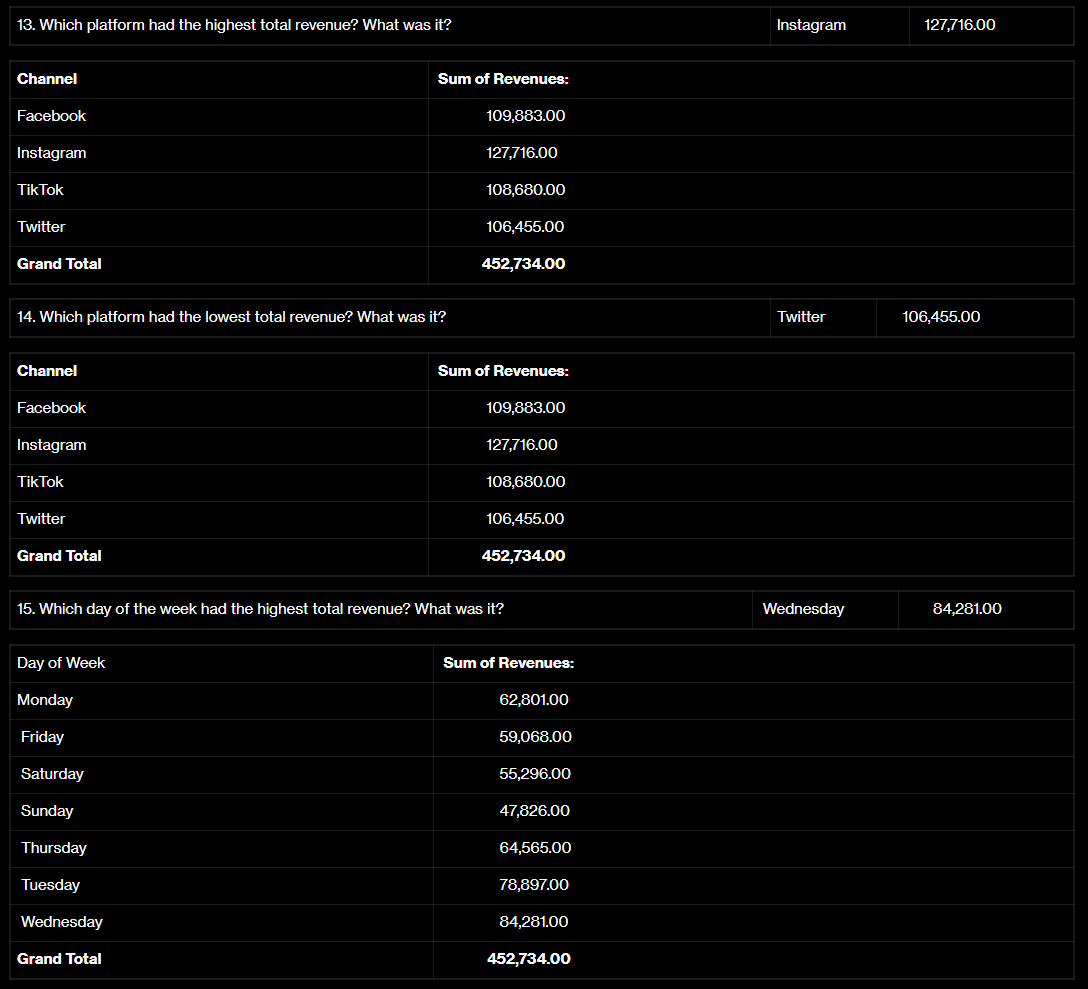
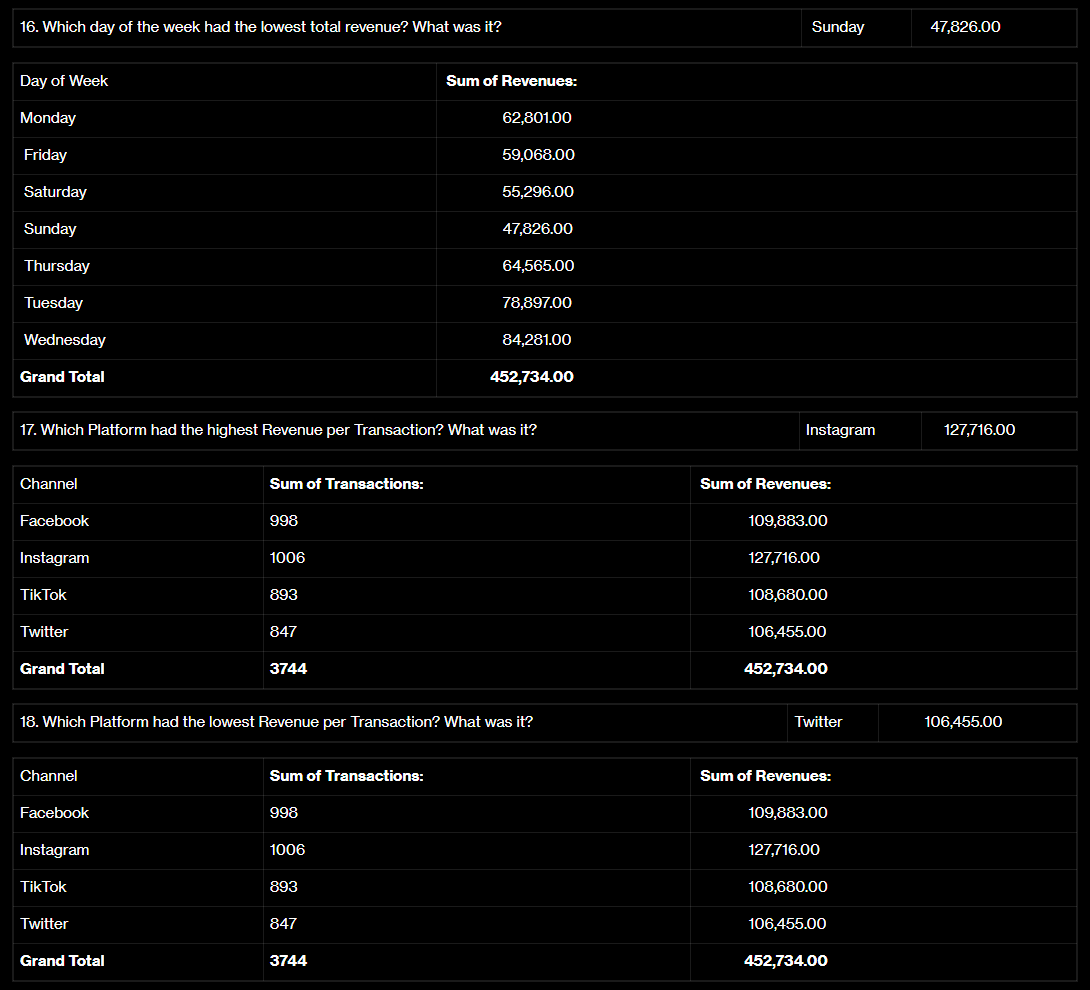
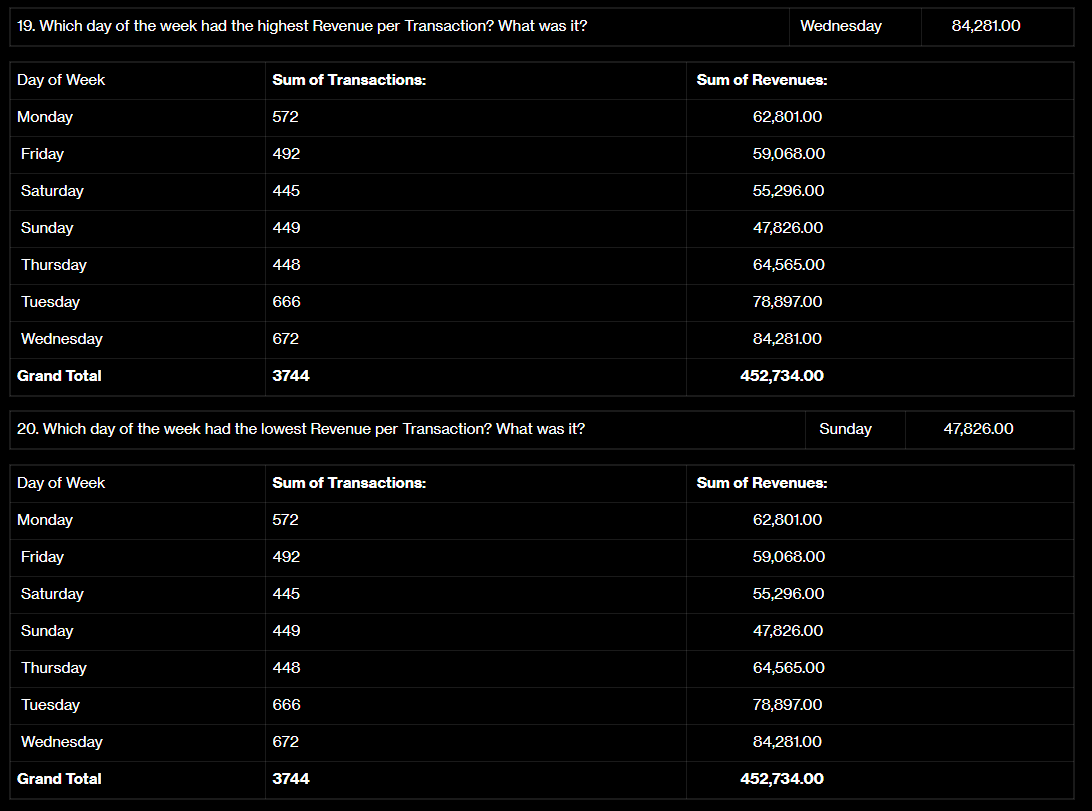
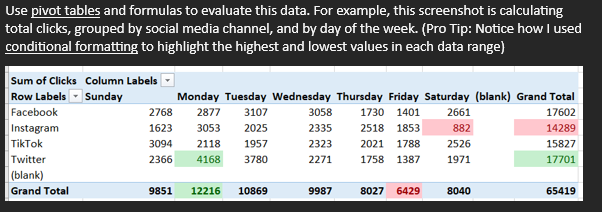
1. Which platform had the highest number of clicks? What was it? \begin{tabular}{|l|c|} \hline Channel & Sum of Clicks: \\ \hline Facebook & 34,812.00 \\ \hline Instagram & 32,437.00 \\ \hline TikTok & 37,639.00 \\ \hline Twitter & 28,327.00 \\ \hline Grand Total & 133,215.00 \\ \hline \end{tabular} 2. Which platform had the lowest number of clicks? What was it? \begin{tabular}{|l|r|} \hline Channel & Sum of Clicks: \\ \hline Facebook & 34,812.00 \\ \hline Instagram & 32,437.00 \\ \hline TikTok & 37,639.00 \\ \hline Twitter & 28,327.00 \\ \hline Grand Total & 133,215.00 \\ \hline \end{tabular} 3. Which day of the week had the highest number of clicks? What was it? Day of the week Sum of Clicks: Monday Friday Saturday Sunday \begin{tabular}{|l|r|} \hline Thursday & 15,087.00 \\ \hline Tuesday & 20,915.00 \\ \hline Wednesday & 23,254.00 \\ \hline Grand Total & 133,215.00 \\ \hline \end{tabular} 11. Which day of the week had the highest conversion rate? What was it? \begin{tabular}{|l|l|l|l|} \hline Day of Week & Sum of Clicks: & Sum of Transactions: & Conversion Rate ( No.of Transactions/No. of Clicks x 100) \\ \hline Monday & 22321 & 572 & 256.26% \\ \hline Friday & 16515 & 492 & 297.91% \\ \hline Saturday & 17723 & 445 & 251.09% \\ \hline Sunday & 17400 & 449 & 258.05% \\ \hline Thursday & 15087 & 448 & 296.94% \\ \hline Tuesday & 20915 & 666 & 318.43% \\ \hline Wednesday & 23254 & 672 & 288.98% \\ \hline Grand Total & 133215 & 3744 & \\ \hline \end{tabular} 12. Which day of the week had the lowest conversion rate? What was it? \begin{tabular}{|l|l|l|l|} \hline Day of Week & Sum of Clicks: & Sum of Transactions: & Conversion Rate ( No.of Transactions/No. of Clicks x 100) \\ \hline Monday & 22321 & 572 & 256.26% \\ \hline Friday & 16515 & 492 & 297.91% \\ \hline Saturday & 17723 & 445 & 251.09% \\ \hline Sunday & 17400 & 449 & 258.05% \\ \hline Thursday & 15087 & 448 & 296.94% \\ \hline Tuesday & 20915 & 666 & 318.43% \\ \hline Wednesday & 23254 & 672 & 288.98% \\ \hline Grand Total & 133215 & 3744 & \\ \hline \end{tabular} 13. Which platform had the highest total revenue? What was it? \begin{tabular}{|l|r|} \hline Channel & Sum of Revenues: \\ \hline Facebook & 109,883.00 \\ \hline Instagram & 127,716.00 \\ \hline TikTok & 108,680.00 \\ \hline Twitter & 106,455.00 \\ \hline Grand Total & 452,734.00 \\ \hline \end{tabular} 14. Which platform had the lowest total revenue? What was it? \begin{tabular}{|l|r|} \hline Channel & Sum of Revenues: \\ \hline Facebook & 109,883.00 \\ \hline Instagram & 127,716.00 \\ \hline TikTok & 108,680.00 \\ \hline Twitter & 106,455.00 \\ \hline Grand Total & 452,734.00 \\ \hline \end{tabular} 15. Which day of the week had the highest total revenue? What was it? \begin{tabular}{|l|c|} \hline Day of Week & Sum of Revenues: \\ \hline Monday & 62,801.00 \\ \hline Friday & 59,068.00 \\ \hline Saturday & 55,296.00 \\ \hline Sunday & 47,826.00 \\ \hline Thursday & 64,565.00 \\ \hline Tuesday & 78,897.00 \\ \hline Wednesday & 84,281.00 \\ \hline Grand Total & 452,734.00 \\ \hline \end{tabular} 16. Which day of the week had the lowest total revenue? What was it? Day of Week Sum of Revenues: \begin{tabular}{|l|r|} \hline Monday & 62,801.00 \\ \hline Friday & 59,068.00 \\ \hline Saturday & 55,296.00 \\ \hline Sunday & 47,826.00 \\ \hline Thursday & 64,565.00 \\ \hline Tuesday & 78,897.00 \\ \hline Wednesday & 84,281.00 \\ \hline Grand Total & 452,734.00 \\ \hline \end{tabular} 17. Which Platform had the highest Revenue per Transaction? What was it? \begin{tabular}{|l|l|r|} \hline Channel & Sum of Transactions: & Sum of Revenues: \\ \hline Facebook & 998 & 109,883.00 \\ \hline Instagram & 1006 & 127,716.00 \\ \hline TikTok & 893 & 108,680.00 \\ \hline Twitter & 847 & 106,455.00 \\ \hline Grand Total & 3744 & 452,734.00 \\ \hline \end{tabular} 18. Which Platform had the lowest Revenue per Transaction? What was it? \begin{tabular}{|l|l|l|l|} \hline Channel & Sum of Transactions: & Sum of Revenues: \\ \hline Facebook & 998 & 109,883.00 \\ \hline Instagram & 1006 & 127,716.00 & 108,680.00 \\ \hline TikTok & 893 & 106,455.00 & \\ \hline Twitter & 847 & 452,734.00 \\ \hline Grand Total & 3744 & & \\ \hline \end{tabular} Use pivot tables and formulas to evaluate this data. For example, this screenshot is calculating total clicks, grouped by social media channel, and by day of the week. (Pro Tip: Notice how I usec conditional formatting to highlight the highest and lowest values in each data range) To make sure you are calculating your values correctly, you should be able to reproduce these values: Here's an example of how you might approach each category of questions (e.g. "Clicks"): Glossary of Terms: - Platform: A specific social media/advertising channel, like Facebook. - Impression: An impression represents one advertising "view". If five people seen an ad, there are five impressions. - Click: When a person sees an ad and clicks on it. - Transaction: A purchase. - Click-Thru Rate: The percent of views that resulted in a click. - Conversion Rate: The percent of clicks that resulted in a transaction (purchase). - ROAS: This is the percent "return on ad spend". It is identical to ROI. You may be asked to calculate it using revenue and/or profit. - Pivot Tables: This is a simple but powerful data analysis tool built into Microsoft Excel. If you haven't used pivot tables before (or don't remember how to use them), I've provided a series of short tutorial videos in the content module. 1. Which platform had the highest number of clicks? What was it? \begin{tabular}{|l|c|} \hline Channel & Sum of Clicks: \\ \hline Facebook & 34,812.00 \\ \hline Instagram & 32,437.00 \\ \hline TikTok & 37,639.00 \\ \hline Twitter & 28,327.00 \\ \hline Grand Total & 133,215.00 \\ \hline \end{tabular} 2. Which platform had the lowest number of clicks? What was it? \begin{tabular}{|l|r|} \hline Channel & Sum of Clicks: \\ \hline Facebook & 34,812.00 \\ \hline Instagram & 32,437.00 \\ \hline TikTok & 37,639.00 \\ \hline Twitter & 28,327.00 \\ \hline Grand Total & 133,215.00 \\ \hline \end{tabular} 3. Which day of the week had the highest number of clicks? What was it? Day of the week Sum of Clicks: Monday Friday Saturday Sunday \begin{tabular}{|l|r|} \hline Thursday & 15,087.00 \\ \hline Tuesday & 20,915.00 \\ \hline Wednesday & 23,254.00 \\ \hline Grand Total & 133,215.00 \\ \hline \end{tabular} 11. Which day of the week had the highest conversion rate? What was it? \begin{tabular}{|l|l|l|l|} \hline Day of Week & Sum of Clicks: & Sum of Transactions: & Conversion Rate ( No.of Transactions/No. of Clicks x 100) \\ \hline Monday & 22321 & 572 & 256.26% \\ \hline Friday & 16515 & 492 & 297.91% \\ \hline Saturday & 17723 & 445 & 251.09% \\ \hline Sunday & 17400 & 449 & 258.05% \\ \hline Thursday & 15087 & 448 & 296.94% \\ \hline Tuesday & 20915 & 666 & 318.43% \\ \hline Wednesday & 23254 & 672 & 288.98% \\ \hline Grand Total & 133215 & 3744 & \\ \hline \end{tabular} 12. Which day of the week had the lowest conversion rate? What was it? \begin{tabular}{|l|l|l|l|} \hline Day of Week & Sum of Clicks: & Sum of Transactions: & Conversion Rate ( No.of Transactions/No. of Clicks x 100) \\ \hline Monday & 22321 & 572 & 256.26% \\ \hline Friday & 16515 & 492 & 297.91% \\ \hline Saturday & 17723 & 445 & 251.09% \\ \hline Sunday & 17400 & 449 & 258.05% \\ \hline Thursday & 15087 & 448 & 296.94% \\ \hline Tuesday & 20915 & 666 & 318.43% \\ \hline Wednesday & 23254 & 672 & 288.98% \\ \hline Grand Total & 133215 & 3744 & \\ \hline \end{tabular} 13. Which platform had the highest total revenue? What was it? \begin{tabular}{|l|r|} \hline Channel & Sum of Revenues: \\ \hline Facebook & 109,883.00 \\ \hline Instagram & 127,716.00 \\ \hline TikTok & 108,680.00 \\ \hline Twitter & 106,455.00 \\ \hline Grand Total & 452,734.00 \\ \hline \end{tabular} 14. Which platform had the lowest total revenue? What was it? \begin{tabular}{|l|r|} \hline Channel & Sum of Revenues: \\ \hline Facebook & 109,883.00 \\ \hline Instagram & 127,716.00 \\ \hline TikTok & 108,680.00 \\ \hline Twitter & 106,455.00 \\ \hline Grand Total & 452,734.00 \\ \hline \end{tabular} 15. Which day of the week had the highest total revenue? What was it? \begin{tabular}{|l|c|} \hline Day of Week & Sum of Revenues: \\ \hline Monday & 62,801.00 \\ \hline Friday & 59,068.00 \\ \hline Saturday & 55,296.00 \\ \hline Sunday & 47,826.00 \\ \hline Thursday & 64,565.00 \\ \hline Tuesday & 78,897.00 \\ \hline Wednesday & 84,281.00 \\ \hline Grand Total & 452,734.00 \\ \hline \end{tabular} 16. Which day of the week had the lowest total revenue? What was it? Day of Week Sum of Revenues: \begin{tabular}{|l|r|} \hline Monday & 62,801.00 \\ \hline Friday & 59,068.00 \\ \hline Saturday & 55,296.00 \\ \hline Sunday & 47,826.00 \\ \hline Thursday & 64,565.00 \\ \hline Tuesday & 78,897.00 \\ \hline Wednesday & 84,281.00 \\ \hline Grand Total & 452,734.00 \\ \hline \end{tabular} 17. Which Platform had the highest Revenue per Transaction? What was it? \begin{tabular}{|l|l|r|} \hline Channel & Sum of Transactions: & Sum of Revenues: \\ \hline Facebook & 998 & 109,883.00 \\ \hline Instagram & 1006 & 127,716.00 \\ \hline TikTok & 893 & 108,680.00 \\ \hline Twitter & 847 & 106,455.00 \\ \hline Grand Total & 3744 & 452,734.00 \\ \hline \end{tabular} 18. Which Platform had the lowest Revenue per Transaction? What was it? \begin{tabular}{|l|l|l|l|} \hline Channel & Sum of Transactions: & Sum of Revenues: \\ \hline Facebook & 998 & 109,883.00 \\ \hline Instagram & 1006 & 127,716.00 & 108,680.00 \\ \hline TikTok & 893 & 106,455.00 & \\ \hline Twitter & 847 & 452,734.00 \\ \hline Grand Total & 3744 & & \\ \hline \end{tabular} Use pivot tables and formulas to evaluate this data. For example, this screenshot is calculating total clicks, grouped by social media channel, and by day of the week. (Pro Tip: Notice how I usec conditional formatting to highlight the highest and lowest values in each data range) To make sure you are calculating your values correctly, you should be able to reproduce these values: Here's an example of how you might approach each category of questions (e.g. "Clicks"): Glossary of Terms: - Platform: A specific social media/advertising channel, like Facebook. - Impression: An impression represents one advertising "view". If five people seen an ad, there are five impressions. - Click: When a person sees an ad and clicks on it. - Transaction: A purchase. - Click-Thru Rate: The percent of views that resulted in a click. - Conversion Rate: The percent of clicks that resulted in a transaction (purchase). - ROAS: This is the percent "return on ad spend". It is identical to ROI. You may be asked to calculate it using revenue and/or profit. - Pivot Tables: This is a simple but powerful data analysis tool built into Microsoft Excel. If you haven't used pivot tables before (or don't remember how to use them), I've provided a series of short tutorial videos in the content moduleStep by Step Solution
There are 3 Steps involved in it
Step: 1

Get Instant Access to Expert-Tailored Solutions
See step-by-step solutions with expert insights and AI powered tools for academic success
Step: 2

Step: 3

Ace Your Homework with AI
Get the answers you need in no time with our AI-driven, step-by-step assistance
Get Started


