Answered step by step
Verified Expert Solution
Link Copied!

Question

1 Approved Answer

ANSWER ONLY!!! Will mark wrong if not!! B) Obtain a simple linear regression model to estimate the amount of O-ring expansion as a function of

ANSWER ONLY!!! Will mark wrong if not!!
B) Obtain a simple linear regression model to estimate the amount of O-ring expansion as a function of atmospheric temperatureWhat is the estimated regression function? (Let X_{1} represent the temperature in Fahrenheit and represent the percentage of D-ring expansionRound your numerical values to four decimal places)
C) Interpret the R ^ 2 statistic for the model you obtained. (Enter your answer as a percent. Round your answer to two decimal places.) The R ^ 2 statistic indicates that approximately 96.61 accounted forby temperature % of the total variation inthe percentage of O-ring expansion
D) Suppose that NASA officials are considering launching a space shuttle when the temperature is 24 degrees What amount of O-ring expansion ( should they expect at this temperature according to your model? (Round your answer to two decimal places.)
E) On the basis of your analysis of these data, would you recommend that the shuttle be the temperature 24 degreesWhy why not?
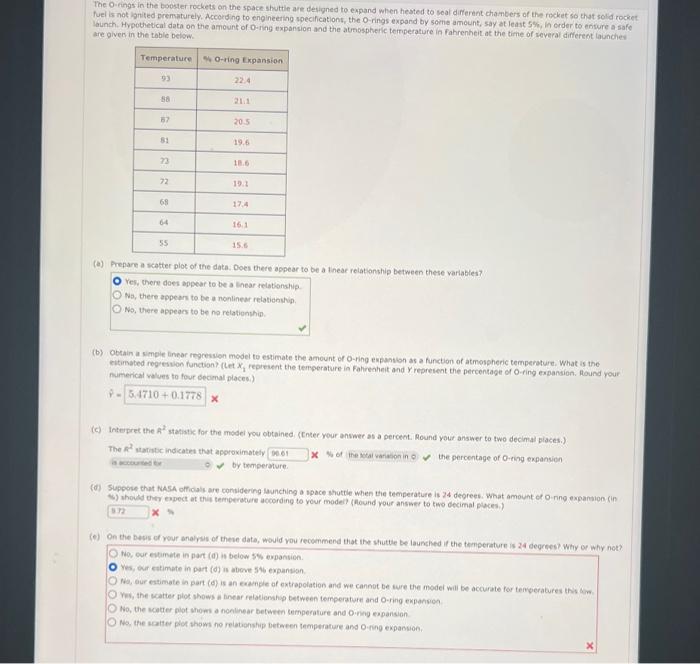
image text in transcribed
The o-rings in the booster reckets on the space shuttie aye devigned to expand when hested to seal different chambers of the rocket so that sold rocket fuel is not ionited prematurely. Aceording to engineering specifications, the 0 -rings expond by some amount, say at least 5%, in order to ensure a safe. lainch. Hypothetical data on the amount of o:ing expansion and the atmospheric temperature in fahrenheit at the time of several different launches are gives in the toble below. (a) Prepare a scatter plot of the data. Does there appear to be a tnear relationship between these variables? Yes, there does appear to be a linear relationship. Nis, there appears to be a nonlinear relatienthip. No, there appears to be no relationshi. (b) Obtain a simpie linear regression model to estimate the amount of O-iing expantion as a function of atmospheric temperature. What is the eitirated regression function) (tet x1 represent the temperature in Fahreaheit and y repreient the percentage of o-fing espansion. Aound your. fumerical values to four secimal placesi.) = (c) Intepret the A2 statiate for the model you obtained (Cnter your answer as a perceet. Aound your answer to two decimal biaces.) The R2 staribc indicates that aporoximatedy x of the percentage of O-ring expansion by temperature. (d) Suppose that NAsA offidals are considering launching a space shuttle when the temperature is 24 deorees. What amount er o-nng expandion (in. (3) shoudd ther expect at thilit temperedure according to your model? (Alound your answer to tho decimal places.) (e) On the bess of your anaiyss of these data, would vou recommend that ite shuttie be launshed if the temperature is 24 degrees? Why or why not? Ho, eur evamete in part (d) is below sw evpansien. Yes, eur estimate in part (d) a above 516 expansian. Wa, eur estimate in part (o) is an example of extrabolation and we cannot be ture the modei will be accurate for tenveratures this tim. Yes, the scatter plot shows in boear relatiemship between temperatwre and o-ring expansen Wo, the scatier plot shows a nonlinear betweth temperature and Oining empansion. Ho. the scatter plot showi no relationship betacen temperature and oring expaosion

Step by Step Solution

There are 3 Steps involved in it

Step: 1

blur-text-image

Get Instant Access to Expert-Tailored Solutions

See step-by-step solutions with expert insights and AI powered tools for academic success

Step: 2

blur-text-image_2

Step: 3

blur-text-image_3

Ace Your Homework with AI

Get the answers you need in no time with our AI-driven, step-by-step assistance

Get Started

Recommended Textbook for

OM operations management

Authors: David Alan Collier, James R. Evans

5th edition

1285451376, 978-1285451374

More Books

Students also viewed these General Management questions