

Answered step by step
Verified Expert Solution
Question
1 Approved Answer
answer question 2 only and please show all work 1. Raw data set for variables X and Y are: X:50,43,45,60,38 For Y we have 23,
answer question 2 only and please show all work 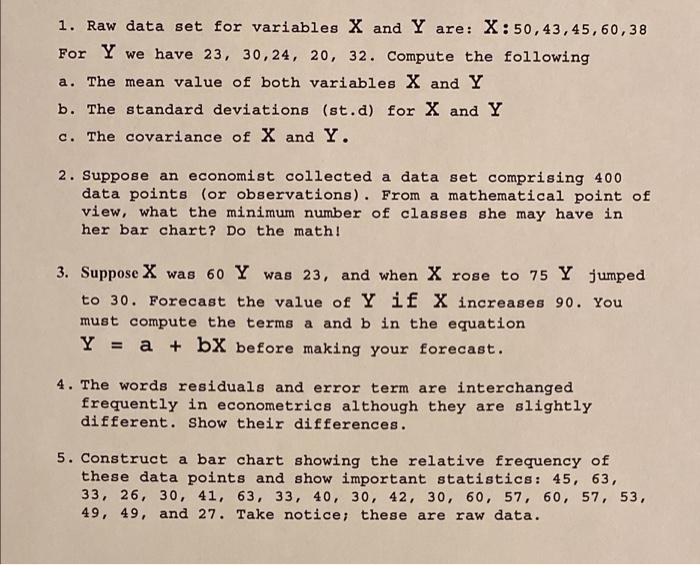
1. Raw data set for variables X and Y are: X:50,43,45,60,38 For Y we have 23, 30,24, 20, 32. Compute the following a. The mean value of both variables X and Y b. The standard deviations (st.d) for X and Y c. The covariance of X and Y. 2. Suppose an economist collected a data set comprising 400 data points (or observations). From a mathematical point of view, what the minimum number of classes she may have in her bar chart? Do the math! 3. Suppose X was 60 Y was 23, and when X rose to 75 Y jumped to 30. Forecast the value of Y if X increases 90. You must compute the terms a and b in the equation Y = a + bx before making your forecast. 4. The words residuals and error term are interchanged frequently in econometrics although they are slightly different. Show their differences. 5. Construct a bar chart showing the relative frequency of these data points and show important statistics : 45, 63, 33, 26, 30, 41, 63, 33, 40, 30, 42, 30, 60, 57, 60, 57, 53, 49, 49, and 27. Take notice; these are raw data Step by Step Solution
There are 3 Steps involved in it
Step: 1

Get Instant Access to Expert-Tailored Solutions
See step-by-step solutions with expert insights and AI powered tools for academic success
Step: 2

Step: 3
Ace Your Homework with AI
Get the answers you need in no time with our AI-driven, step-by-step assistance
Get Started
Personal Finance
Authors: Jack Kapoor, Les Dlabay, Robert J. Hughes, Arshad Ahmad, Jordan Fortino
6th Canadian edition
1259453146, 978-1259453144