

Answered step by step
Verified Expert Solution
Question
1 Approved Answer
Answer question in excel and show formula where required or workings Exercises 1. Lavare, located in the Chicago suburbs, is a major manufac- turer of
Answer question in excel and show formula where required or workings
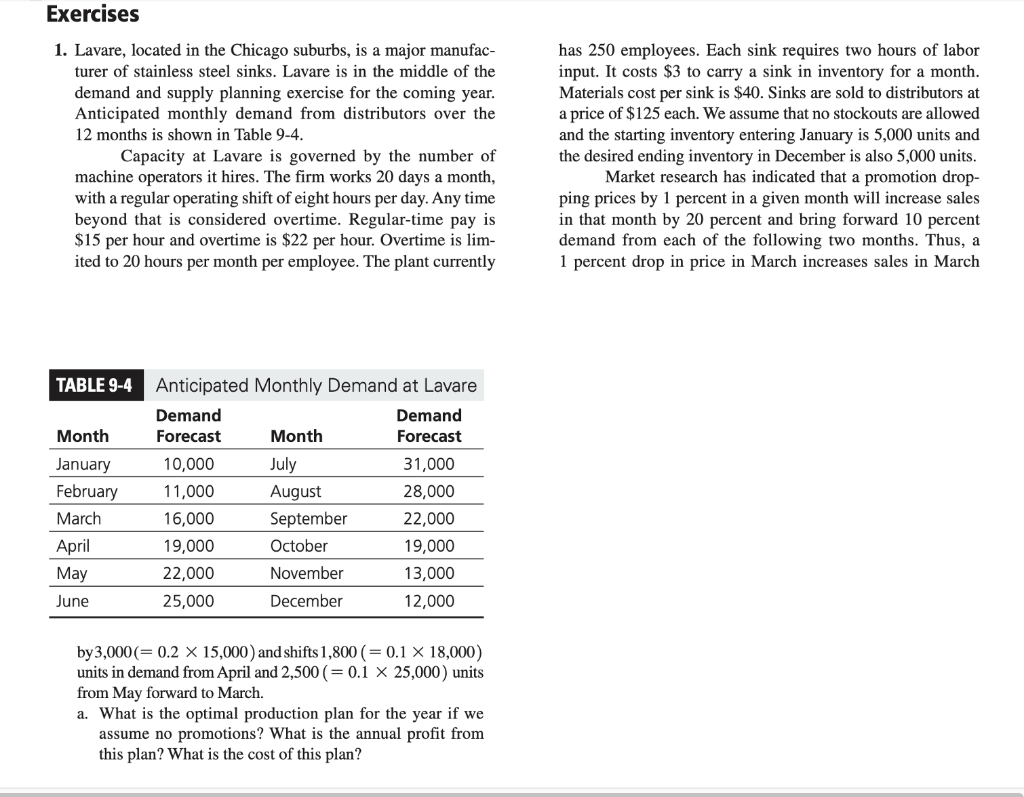
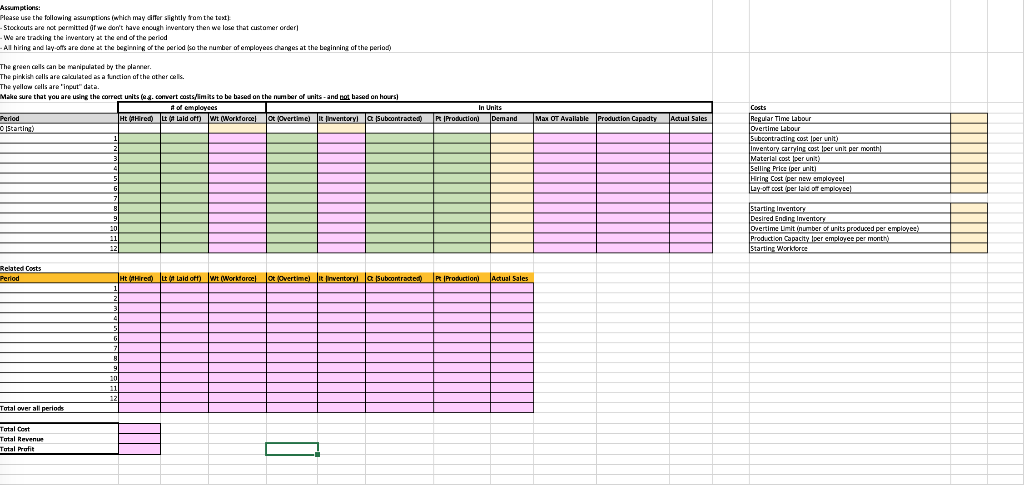
Exercises 1. Lavare, located in the Chicago suburbs, is a major manufac- turer of stainless steel sinks. Lavare is in the middle of the demand and supply planning exercise for the coming year. Anticipated monthly demand from distributors over the 12 months is shown in Table 9-4. Capacity at Lavare is governed by the number of machine operators it hires. The firm works 20 days a month, with a regular operating shift of eight hours per day. Any time beyond that is considered overtime. Regular-time pay is $15 per hour and overtime is $22 per hour. Overtime is lim- ited to 20 hours per month per employee. The plant currently has 250 employees. Each sink requires two hours of labor input. It costs $3 to carry a sink in inventory for a month. Materials cost per sink is $40. Sinks are sold to distributors at a price of $125 each. We assume that no stockouts are allowed and the starting inventory entering January is 5,000 units and the desired ending inventory in December is also 5,000 units. Market research has indicated that a promotion drop- ping prices by 1 percent in a given month will increase sales in that month by 20 percent and bring forward 10 percent demand from each of the following two months. Thus, a 1 percent drop in price in March increases sales in March TABLE 9-4 Month January February March April May June Anticipated Monthly Demand at Lavare Demand Demand Forecast Month Forecast 10,000 July 31,000 11,000 August 28,000 16,000 September 22,000 19,000 October 19,000 22,000 November 13,000 25,000 December 12,000 by3,000(= 0.2 x 15,000) and shifts 1,800 ( = 0.1 X 18,000) units in demand from April and 2,500 ( = 0.1 X 25,000) units from May forward to March. a. What is the optimal production plan for the year if we assume no promotions? What is the annual profit from this plan? What is the cost of this plan? Assumptions: Please use the following assumption (which may differ slightly from the text) Stockouts are not permitted of we don't have enough inventory then we lose that customer order We are tracking the inventary at the end of the period All hiring and lay-offs are done at the beginning of the period fo the number of employees changes at the beginning of the period The green cells can be manipulated by the planner. The pinkish calls are calated as a function of the other als The yellow calls are 'inout" data. Make sure that you are using the correct units (es.comvert costs/limits to be based on the number of units -and not based on hours) # of employees Period Ht Hire L 01 Laid oft) Wt (Workforcel OtlOvertime) It inventoryl a Subcontracted Starting) In Units P Production Demand Max OT Available Production Capadity Actual Sales Costs Regular Time Labour Overtime Labour Subcontracting cost per unit) Inventory carrying cost per unit per month Material cost per unit) Selling Price per unit) Hiring Cost (per new employee Lay of cost per la of employee 3 5 GO 7 8 9 10 11 12 Starting Inventory Desired Endins Inventory Overtime Limit number of units produced per employee) Production Capacity Iper employee per month Starting Workforce Related Costs Period Ht tired of laid of) Wt (Workforce lot Overtime) inventoryl Subcontracten Production) Actual Sales 1 2 3 5 G 7 B 9 10 11 12 Total over all periosts Total Cent Total Revenue Total Profit = Exercises 1. Lavare, located in the Chicago suburbs, is a major manufac- turer of stainless steel sinks. Lavare is in the middle of the demand and supply planning exercise for the coming year. Anticipated monthly demand from distributors over the 12 months is shown in Table 9-4. Capacity at Lavare is governed by the number of machine operators it hires. The firm works 20 days a month, with a regular operating shift of eight hours per day. Any time beyond that is considered overtime. Regular-time pay is $15 per hour and overtime is $22 per hour. Overtime is lim- ited to 20 hours per month per employee. The plant currently has 250 employees. Each sink requires two hours of labor input. It costs $3 to carry a sink in inventory for a month. Materials cost per sink is $40. Sinks are sold to distributors at a price of $125 each. We assume that no stockouts are allowed and the starting inventory entering January is 5,000 units and the desired ending inventory in December is also 5,000 units. Market research has indicated that a promotion drop- ping prices by 1 percent in a given month will increase sales in that month by 20 percent and bring forward 10 percent demand from each of the following two months. Thus, a 1 percent drop in price in March increases sales in March TABLE 9-4 Month January February March April May June Anticipated Monthly Demand at Lavare Demand Demand Forecast Month Forecast 10,000 July 31,000 11,000 August 28,000 16,000 September 22,000 19,000 October 19,000 22,000 November 13,000 25,000 December 12,000 by3,000(= 0.2 x 15,000) and shifts 1,800 ( = 0.1 X 18,000) units in demand from April and 2,500 ( = 0.1 X 25,000) units from May forward to March. a. What is the optimal production plan for the year if we assume no promotions? What is the annual profit from this plan? What is the cost of this plan? Assumptions: Please use the following assumption (which may differ slightly from the text) Stockouts are not permitted of we don't have enough inventory then we lose that customer order We are tracking the inventary at the end of the period All hiring and lay-offs are done at the beginning of the period fo the number of employees changes at the beginning of the period The green cells can be manipulated by the planner. The pinkish calls are calated as a function of the other als The yellow calls are 'inout" data. Make sure that you are using the correct units (es.comvert costs/limits to be based on the number of units -and not based on hours) # of employees Period Ht Hire L 01 Laid oft) Wt (Workforcel OtlOvertime) It inventoryl a Subcontracted Starting) In Units P Production Demand Max OT Available Production Capadity Actual Sales Costs Regular Time Labour Overtime Labour Subcontracting cost per unit) Inventory carrying cost per unit per month Material cost per unit) Selling Price per unit) Hiring Cost (per new employee Lay of cost per la of employee 3 5 GO 7 8 9 10 11 12 Starting Inventory Desired Endins Inventory Overtime Limit number of units produced per employee) Production Capacity Iper employee per month Starting Workforce Related Costs Period Ht tired of laid of) Wt (Workforce lot Overtime) inventoryl Subcontracten Production) Actual Sales 1 2 3 5 G 7 B 9 10 11 12 Total over all periosts Total Cent Total Revenue Total Profit =Step by Step Solution
There are 3 Steps involved in it
Step: 1

Get Instant Access to Expert-Tailored Solutions
See step-by-step solutions with expert insights and AI powered tools for academic success
Step: 2

Step: 3
Ace Your Homework with AI
Get the answers you need in no time with our AI-driven, step-by-step assistance
Get Started
Database Fundamentals Study Guide
Authors: Dr. Sergio Pisano
1st Edition
B09K1WW84J, 979-8985115307