

Answered step by step
Verified Expert Solution
Question
1 Approved Answer
Answer questions 2,5, and 7 please . All information necessary is provided Actual and Normal Costing, CVP analysis, and Activity-Based Costing 1. What were the
Answer questions 2,5, and 7 please
.
All information necessary is provided
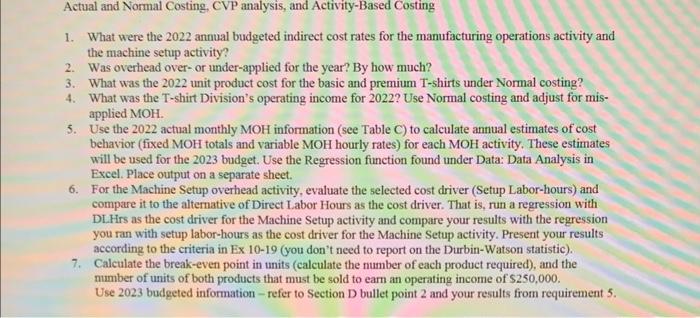
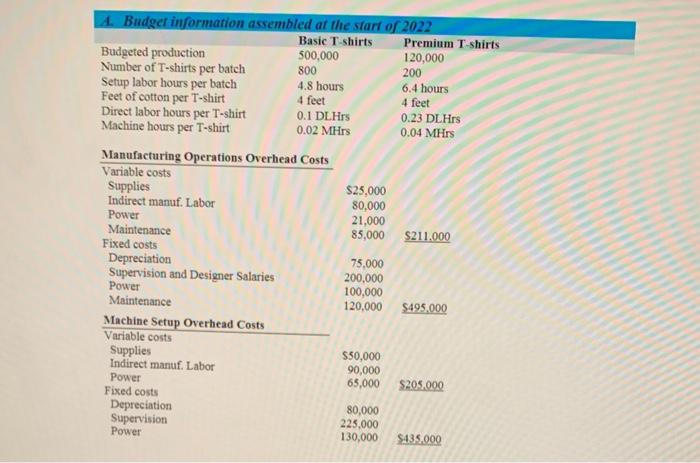
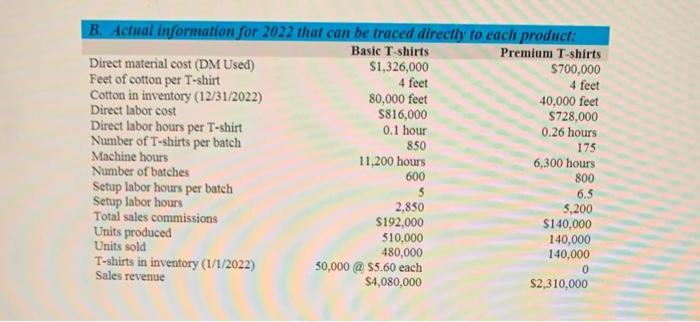
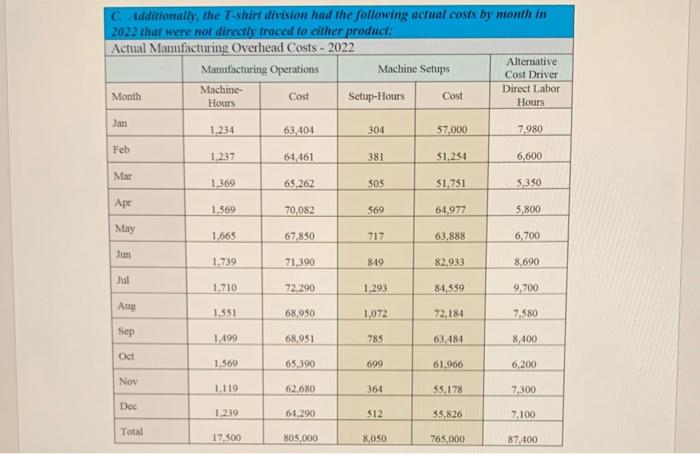
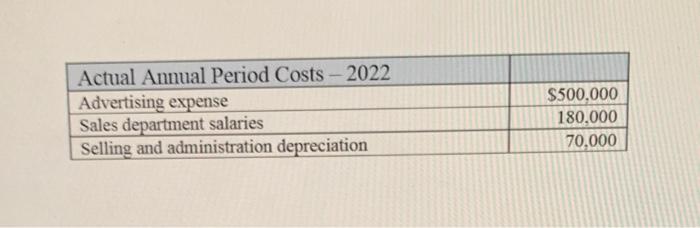
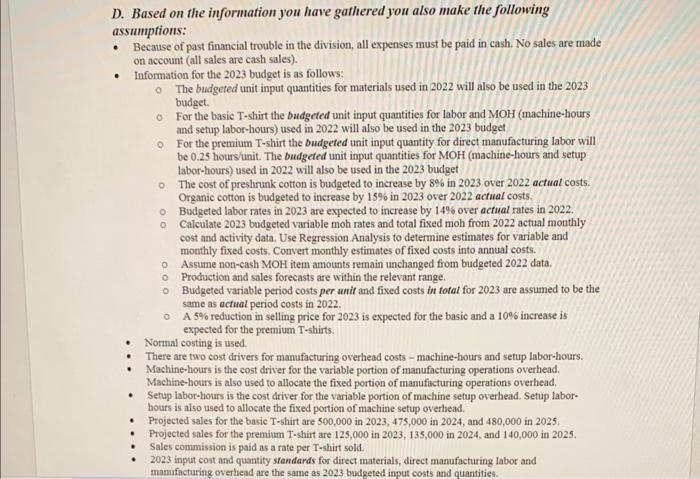
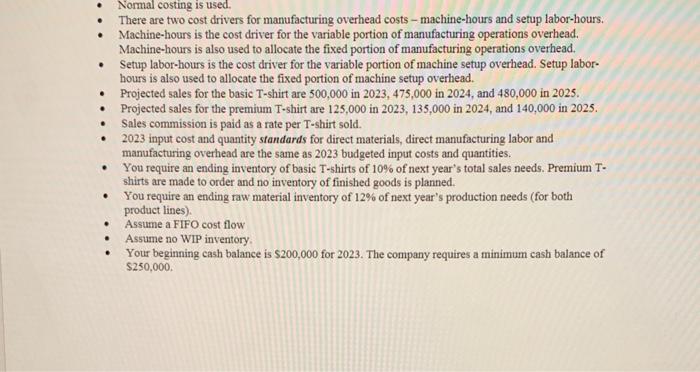
Actual and Normal Costing, CVP analysis, and Activity-Based Costing 1. What were the 2022 annual budgeted indirect cost rates for the manufacturing operations activity and the machine setup activity? 2. Was overhead over- or under-applied for the year? By how much? 3. What was the 2022 unit product cost for the basic and premium T-shirts under Normal costing? 4. What was the T-shirt Division's operating income for 2022 ? Use Normal costing and adjust for misapplied MOH. 5. Use the 2022 actual monthly MOH information (see Table C) to calculate annual estimates of cost behavior (fixed MOH totals and variable MOH hourly rates) for each MOH activity. These estimates will be used for the 2023 budget. Use the Regression function found under Data: Data Analysis in Excel. Place output on a separate sheet. 6. For the Machine Setup overhead activity, evaluate the selected cost driver (Setup Labor-hours) and compare it to the alternative of Direct Labor Hours as the cost driver. That is, nun a regression with DL.Hrs as the cost driver for the Machine Setup activity and compare your results with the regression you ran with setup labor-hours as the cost driver for the Machine Setup activity. Present your results according to the criteria in Ex 10-19 (you don't need to report on the Durbin-Watson statistic). 7. Calculate the break-even point in units (calculate the number of each product required), and the number of units of both products that must be sold to earn an operating income of $250,000. Use 2023 budgeted information - refer to Section D bullet point 2 and your results from requirement 5. B. Actual information for 2022 that can be traced directly to each producf: Directmaterialcost(DMUsed)FeetofcottonperT-shirtCottonininventory(12/31/2022)DirectlaborcostDirectlaborhoursperT-shirtNumberofT-shirtsperbatchMachinehoursNumberofbatchesSetuplaborhoursperbatchSetuplaborhoursTotalsalescommissionsUnitsproducedUnitssoldT-shirtsininventory(1/1/2022)SalesrevenueBasicT-shirts$1,326,0004feet80,000feet$816,0000.1hour85011,200hours60052,850$192,000510,000480,000$5,60each$4,080,000PremiumT-shirts$700,0004feet40,000feet$728,0000.26hours1756,300hours8006.55,200$140,000140,000140,0000$2,310,000 C. Ldditionally, the T-shirt division had the following actual coses by month in 2022 that were nof directly fraced to cither product: Actual Manufacturing Overhead Costs - 2022 \begin{tabular}{|l|c|c|c|c|c|} \hline & \multicolumn{2}{|c|}{ Manufacturing Operations } & \multicolumn{2}{|c|}{ Machine Setups } & AlternativeCostDriver \\ \hline Month & Machine-Hours & Cost & Setup-Hours & Cost & DirectLaborHours \\ \hline Jan & 1,234 & 63,404 & 304 & 57,000 & 7,980 \\ \hline Feb & 1,237 & 64,461 & 381 & 51,254 & 6,600 \\ \hline Mar & 1,369 & 65,262 & 505 & 51,751 & 5,350 \\ \hline Apr & 1,569 & 70,082 & 569 & 64,977 & 5,800 \\ \hline May & 1,665 & 67,850 & 717 & 63,888 & 6,700 \\ \hline Jun & 1,739 & 71,390 & 849 & 82,933 & 8,690 \\ \hline Jul & 1,710 & 72,290 & 1,293 & 84,559 & 9,700 \\ \hline Aug & 1,551 & 68,950 & 1,072 & 72,184 & 7,580 \\ \hline Sep & 1,499 & 68,951 & 785 & 63,484 & 8,400 \\ \hline Oet & 1,569 & 65,390 & 699 & 61,966 & 6,200 \\ \hline Nov & 1,119 & 62,680 & 364 & 55,178 & 7,300 \\ \hline Dec & 1,239 & 64,290 & 512 & 55,826 & 7,100 \\ \hline Total & 17,500 & 805,000 & 8,050 & 765,000 & 87,400 \\ \hline \end{tabular} \begin{tabular}{|l|r|} \hline Actual Annual Period Costs - 2022 & \\ \hline Advertising expense & $500,000 \\ \hline Sales department salaries & 180,000 \\ \hline Selling and administration depreciation & 70,000 \\ \hline \end{tabular} D. Based on the information you have gathered you also make the following assumptions: - Because of past financial trouble in the division, all expenses must be paid in cash. No sales are made on account (all sales are cash sales). - Information for the 2023 budget is as follows: The budgeted unit input quantities for materials used in 2022 will also be used in the 2023 budget. For the basic T-shirt the budgeted unit input quantities for labor and MOH (machine-hours and setup labor-hours) used in 2022 will also be used in the 2023 budget For the premium T-shirt the budgeted unit input quantity for direct manufacturing labor will be 0.25 hours/unit. The budgeted unit input quantities for MOH (machine-hours and setup labor-hours) used in 2022 will also be used in the 2023 budget - The cost of preshrunk cotton is budgeted to increase by 8% in 2023 over 2022 actuat costs. Organic cotton is budgeted to increase by 15% in 2023 over 2022 actual costs. Budgeted labor rates in 2023 are expected to increase by 14% over actual rates in 2022. Calculate 2023 bodgeted variable moh rates and total fixed moh from 2022 actual monthly cost and activity data. Use Regression Analysis to determine estimates for variable and monthly fixed costs, Convert monthly estimates of fixed costs into annual costs. Assume non-cash MOH item amounts remain unchanged from budgeted 2022 data. Production and sales forecasts are within the relevant range. Budgeted variable period costs per unit and fixed costs in totat for 2023 are assumed to be the same as actual period costs in 2022. A 5% reduction in selling price for 2023 is expected for the basic and a 10% increase is expected for the premium T-shirts. - Normal costing is used. - There are two cost drivers for manufacturing overhead costs - machine-hours and setup labor-hours. - Machine-hours is the cost driver for the variable portion of manufacturing operations overhead. Machine-hours is also used to allocate the fixed portion of manufacturing operations overhead. - Setup labor-hours is the cost driver for the variable portion of machine setup overhead. Setup laborhours is also used to allocate the fixed portion of machine setup overhead. - Projected sales for the basic T-shirt are 500,000 in 2023, 475,000 in 2024, and 480,000 in 2025. - Projected sales for the preminm T-shirt are 125,000 in 2023, 135,000 in 2024, and 140,000 in 2025. - Sales commission is paid as a rate per T-shirt sold. - 2023 input cost and quantity standards for direct materials, direct manufacturing labor and manufacturing overhead are the same as 2023 budgeted input costs and quantities. - Normal costing is used. - There are two cost drivers for manufacturing overhead costs - machine-hours and setup labor-hours. - Machine-hours is the cost driver for the variable portion of manufacturing operations overhead. Machine-hours is also used to allocate the fixed portion of manufacturing operations overhead. - Setup labor-hours is the cost driver for the variable portion of machine setup overhead. Setup laborhours is also used to allocate the fixed portion of machine setup overhead. - Projected sales for the basic T-shirt are 500,000 in 2023, 475,000 in 2024, and 480,000 in 2025. - Projected sales for the premium T-shirt are 125,000 in 2023,135,000 in 2024 , and 140,000 in 2025. - Sales commission is paid as a rate per T-shirt sold. - 2023 input cost and quantity standards for direct materials, direct manufacturing labor and manufacturing overhead are the same as 2023 budgeted input costs and quantities. - You require an ending inventory of basic T-shirts of 10% of next year's total sales needs. Premium Tshirts are made to order and no inventory of finished goods is planned. - You require an ending raw material inventory of 12% of next year's production needs (for both product lines). - Assume a FIFO cost flow - Assume no WIP inventory. - Your beginning cash balance is $200,000 for 2023 . The company requires a minimum cash balance of $250,000. Actual and Normal Costing, CVP analysis, and Activity-Based Costing 1. What were the 2022 annual budgeted indirect cost rates for the manufacturing operations activity and the machine setup activity? 2. Was overhead over- or under-applied for the year? By how much? 3. What was the 2022 unit product cost for the basic and premium T-shirts under Normal costing? 4. What was the T-shirt Division's operating income for 2022 ? Use Normal costing and adjust for misapplied MOH. 5. Use the 2022 actual monthly MOH information (see Table C) to calculate annual estimates of cost behavior (fixed MOH totals and variable MOH hourly rates) for each MOH activity. These estimates will be used for the 2023 budget. Use the Regression function found under Data: Data Analysis in Excel. Place output on a separate sheet. 6. For the Machine Setup overhead activity, evaluate the selected cost driver (Setup Labor-hours) and compare it to the alternative of Direct Labor Hours as the cost driver. That is, nun a regression with DL.Hrs as the cost driver for the Machine Setup activity and compare your results with the regression you ran with setup labor-hours as the cost driver for the Machine Setup activity. Present your results according to the criteria in Ex 10-19 (you don't need to report on the Durbin-Watson statistic). 7. Calculate the break-even point in units (calculate the number of each product required), and the number of units of both products that must be sold to earn an operating income of $250,000. Use 2023 budgeted information - refer to Section D bullet point 2 and your results from requirement 5. B. Actual information for 2022 that can be traced directly to each producf: Directmaterialcost(DMUsed)FeetofcottonperT-shirtCottonininventory(12/31/2022)DirectlaborcostDirectlaborhoursperT-shirtNumberofT-shirtsperbatchMachinehoursNumberofbatchesSetuplaborhoursperbatchSetuplaborhoursTotalsalescommissionsUnitsproducedUnitssoldT-shirtsininventory(1/1/2022)SalesrevenueBasicT-shirts$1,326,0004feet80,000feet$816,0000.1hour85011,200hours60052,850$192,000510,000480,000$5,60each$4,080,000PremiumT-shirts$700,0004feet40,000feet$728,0000.26hours1756,300hours8006.55,200$140,000140,000140,0000$2,310,000 C. Ldditionally, the T-shirt division had the following actual coses by month in 2022 that were nof directly fraced to cither product: Actual Manufacturing Overhead Costs - 2022 \begin{tabular}{|l|c|c|c|c|c|} \hline & \multicolumn{2}{|c|}{ Manufacturing Operations } & \multicolumn{2}{|c|}{ Machine Setups } & AlternativeCostDriver \\ \hline Month & Machine-Hours & Cost & Setup-Hours & Cost & DirectLaborHours \\ \hline Jan & 1,234 & 63,404 & 304 & 57,000 & 7,980 \\ \hline Feb & 1,237 & 64,461 & 381 & 51,254 & 6,600 \\ \hline Mar & 1,369 & 65,262 & 505 & 51,751 & 5,350 \\ \hline Apr & 1,569 & 70,082 & 569 & 64,977 & 5,800 \\ \hline May & 1,665 & 67,850 & 717 & 63,888 & 6,700 \\ \hline Jun & 1,739 & 71,390 & 849 & 82,933 & 8,690 \\ \hline Jul & 1,710 & 72,290 & 1,293 & 84,559 & 9,700 \\ \hline Aug & 1,551 & 68,950 & 1,072 & 72,184 & 7,580 \\ \hline Sep & 1,499 & 68,951 & 785 & 63,484 & 8,400 \\ \hline Oet & 1,569 & 65,390 & 699 & 61,966 & 6,200 \\ \hline Nov & 1,119 & 62,680 & 364 & 55,178 & 7,300 \\ \hline Dec & 1,239 & 64,290 & 512 & 55,826 & 7,100 \\ \hline Total & 17,500 & 805,000 & 8,050 & 765,000 & 87,400 \\ \hline \end{tabular} \begin{tabular}{|l|r|} \hline Actual Annual Period Costs - 2022 & \\ \hline Advertising expense & $500,000 \\ \hline Sales department salaries & 180,000 \\ \hline Selling and administration depreciation & 70,000 \\ \hline \end{tabular} D. Based on the information you have gathered you also make the following assumptions: - Because of past financial trouble in the division, all expenses must be paid in cash. No sales are made on account (all sales are cash sales). - Information for the 2023 budget is as follows: The budgeted unit input quantities for materials used in 2022 will also be used in the 2023 budget. For the basic T-shirt the budgeted unit input quantities for labor and MOH (machine-hours and setup labor-hours) used in 2022 will also be used in the 2023 budget For the premium T-shirt the budgeted unit input quantity for direct manufacturing labor will be 0.25 hours/unit. The budgeted unit input quantities for MOH (machine-hours and setup labor-hours) used in 2022 will also be used in the 2023 budget - The cost of preshrunk cotton is budgeted to increase by 8% in 2023 over 2022 actuat costs. Organic cotton is budgeted to increase by 15% in 2023 over 2022 actual costs. Budgeted labor rates in 2023 are expected to increase by 14% over actual rates in 2022. Calculate 2023 bodgeted variable moh rates and total fixed moh from 2022 actual monthly cost and activity data. Use Regression Analysis to determine estimates for variable and monthly fixed costs, Convert monthly estimates of fixed costs into annual costs. Assume non-cash MOH item amounts remain unchanged from budgeted 2022 data. Production and sales forecasts are within the relevant range. Budgeted variable period costs per unit and fixed costs in totat for 2023 are assumed to be the same as actual period costs in 2022. A 5% reduction in selling price for 2023 is expected for the basic and a 10% increase is expected for the premium T-shirts. - Normal costing is used. - There are two cost drivers for manufacturing overhead costs - machine-hours and setup labor-hours. - Machine-hours is the cost driver for the variable portion of manufacturing operations overhead. Machine-hours is also used to allocate the fixed portion of manufacturing operations overhead. - Setup labor-hours is the cost driver for the variable portion of machine setup overhead. Setup laborhours is also used to allocate the fixed portion of machine setup overhead. - Projected sales for the basic T-shirt are 500,000 in 2023, 475,000 in 2024, and 480,000 in 2025. - Projected sales for the preminm T-shirt are 125,000 in 2023, 135,000 in 2024, and 140,000 in 2025. - Sales commission is paid as a rate per T-shirt sold. - 2023 input cost and quantity standards for direct materials, direct manufacturing labor and manufacturing overhead are the same as 2023 budgeted input costs and quantities. - Normal costing is used. - There are two cost drivers for manufacturing overhead costs - machine-hours and setup labor-hours. - Machine-hours is the cost driver for the variable portion of manufacturing operations overhead. Machine-hours is also used to allocate the fixed portion of manufacturing operations overhead. - Setup labor-hours is the cost driver for the variable portion of machine setup overhead. Setup laborhours is also used to allocate the fixed portion of machine setup overhead. - Projected sales for the basic T-shirt are 500,000 in 2023, 475,000 in 2024, and 480,000 in 2025. - Projected sales for the premium T-shirt are 125,000 in 2023,135,000 in 2024 , and 140,000 in 2025. - Sales commission is paid as a rate per T-shirt sold. - 2023 input cost and quantity standards for direct materials, direct manufacturing labor and manufacturing overhead are the same as 2023 budgeted input costs and quantities. - You require an ending inventory of basic T-shirts of 10% of next year's total sales needs. Premium Tshirts are made to order and no inventory of finished goods is planned. - You require an ending raw material inventory of 12% of next year's production needs (for both product lines). - Assume a FIFO cost flow - Assume no WIP inventory. - Your beginning cash balance is $200,000 for 2023 . The company requires a minimum cash balance of $250,000 Step by Step Solution
There are 3 Steps involved in it
Step: 1

Get Instant Access to Expert-Tailored Solutions
See step-by-step solutions with expert insights and AI powered tools for academic success
Step: 2

Step: 3
Ace Your Homework with AI
Get the answers you need in no time with our AI-driven, step-by-step assistance
Get Started
Mastering Auditing Essentials A Comprehensive Guide To Learn Auditing Essentials
Authors: Cybellium Ltd, Kris Hermans
1st Edition
B0CHL7H261, 979-8861235617