Answer questions 4, 5, and 6 using these tables
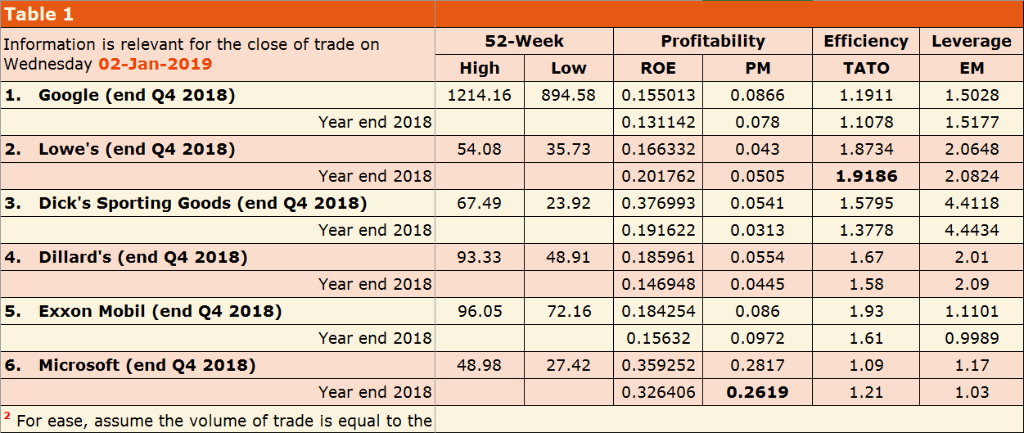
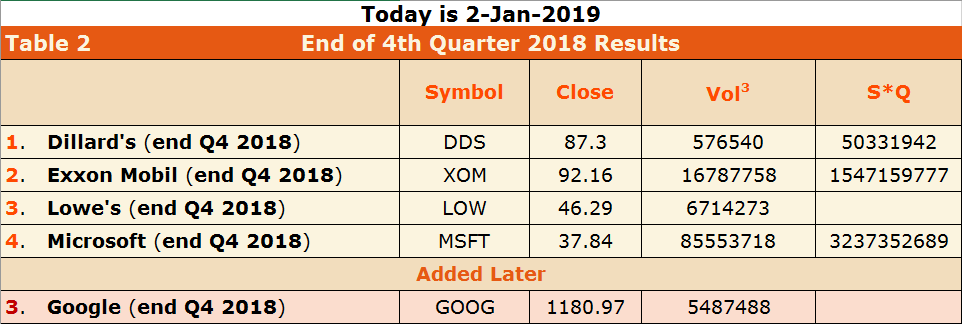
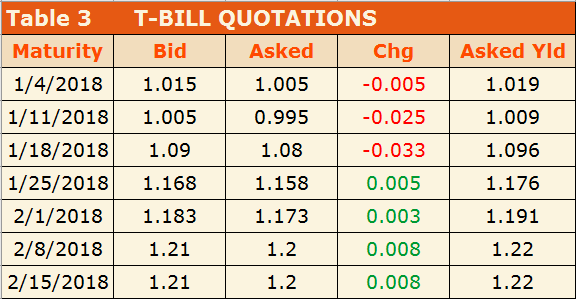
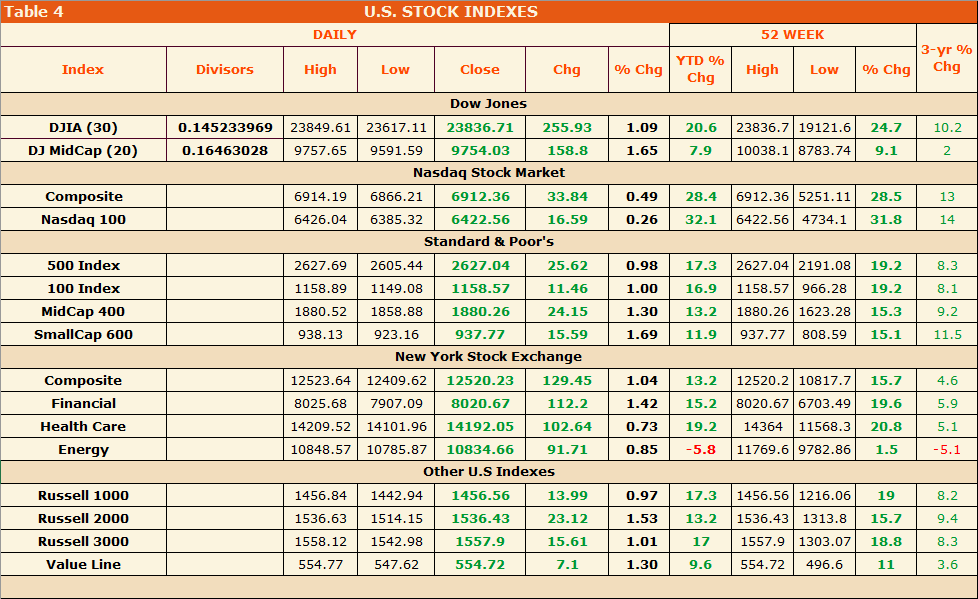
52-Week High Low 1214.16 894.58 54.08 35.73 67.49 23.92 Table 1 Information is relevant for the close of trade on Wednesday 02-Jan-2019 1. Google (end Q4 2018) Year end 2018 2. Lowe's (end Q4 2018) Year end 2018 3. Dick's Sporting Goods (end Q4 2018) Year end 2018 4. Dillard's (end Q4 2018) Year end 2018 5. Exxon Mobil (end Q4 2018) Year end 2018 6. Microsoft (end Q4 2018) Year end 2018 2 For ease, assume the volume of trade is equal to the Profitability | ROEL PM 0.155013 0.0866 0.131142 0.078 0.166332 0.043 0.201762 0.0505 0.376993 0.0541 0.191622 0.0313 0.185961 0.0554 0.146948 0.0445 0.184254 0.086 0.15632 0.0972 0.359252 0.2817 0.326406 0.2619 Efficiency TATO 1.1911 1.1078 1.8734 1.9186 1.5795 1.3778 1.67 1.58 1.93 1.61 1.09 1.21 Leverage EM 1.5028 1.5177 2.0648 2.0824 4.4118 4.4434 2.01 2.09 1.1101 0.9989 1.17 1.03 93.33 48.91 96.05 72.16 48.98 27.42 Today is 2-Jan-2019 End of 4th Quarter 2018 Results Table 2 Symbol Close Vol3 S*Q 50331942 1547159777 1. Dillard's (end Q4 2018) 2. Exxon Mobil (end Q4 2018) 3. Lowe's (end Q4 2018) 4. Microsoft (end Q4 2018) DDS 87.3 92.16 LOW 46.29 MSFT 37.84 Added Later GOOG 1180.97 576540 16787758 6714273 85553718 3237352689 3. Google (end Q4 2018) 5487488 Chg Asked Yld 1.019 1.009 Table 3 Maturity 1/4/2018 1/11/2018 1/18/2018 1/25/2018 2/1/2018 2/8/2018 | 2/15/2018 T-BILL QUOTATIONS Bid Asked 1.015 1.005 -0.005 1.005 0.995 -0.025 1.09 1.08 -0.033 1.168 1.158 0.005 1.183 1.173 0.003 1.21 1.2 0.008 1.21 1.2 0.008 1.096 1.176 1.191 1.22 1.22 Table 4 U.S. STOCK INDEXES DAILY 52 WEEK Index Divisors High 3-yr % Chg Low Close Chg YTD % cho %Chg High Low % Chg DJIA (30) DJ Midcap (20) 1.09 1.65 20.6 7.9 23836.7 19121.6 10038.1 8783.74 24.7 9.1 10.2 2 Composite Nasdaq 100 0.49 0.26 28.4 32.1 6912.36 5251.11 6422.56 4734.1 28.5 31.8 13 14 500 Index 100 Index MidCap 400 SmallCap 600 Dow Jones 0.145233969 23849.61 23617.11 23836.71 255.93 0.16463028 | 9757.65 9591.59 9754.03 158.8 Nasdaq Stock Market 6914.19 6866.21 6912.36 33.84 6426.046385.32 6422.56 16.59 Standard & Poor's 2627.69 2605.44 2627.04 25.62 1158.89 1149.08 1158.57 11.46 1880.52 1858.88 1880.26 24.15 938.13 923.16 937.77 15.59 New York Stock Exchange | 12523.64 12409.62 | 12520.23 129.45 8025.687907.09 8020.67 112.2 14209.52 | 14101.9614192.05 102.64 10848.57 10785.87 10834.66 91.71 Other U.S Indexes 1456,841442.94 1456.56 | 13.99 1536.63 1514.15 1536.43 23.12 1558.121542.98 1557.9 15.61 554.77 547.62 554.72 7.1 0.98 1.00 1.30 1.69 17.3 16.9 13.2 11.9 2627.042191.08 1158.57 966.28 1880.26 1623.28 937.77 808.59 19.2 19.2 15.3 15.1 8.3 8.1 9.2 11.5 Composite Financial Health Care Energy 1.04 1.42 0.73 0.85 13.2 15.2 19.2 -5.8 12520.2 10817.7| 15.7 8020.676703.49 19.6 14364 11568.3 20.8 11769.69782.86 1.5 4.6 5.9 5.1 -5.1 8 Russell 1000 Russell 2000 Russell 3000 Value Line | 0.97 | 17.3 1.53 13.2 1.01 17 1.30 9.6 1456.561216.06. 1536.43 1313.8 1557.9 1303.07 554.72 496.6 19 15.7 18.8 11 .2 9.4 8.3 .6 3 Question 4 O pts For the end Q4 2018 calculate Dillard's (Table 1) Earnings Per Share (EPS). Show 4 decimals. (1pt) Question 5 O pts The number of individual shares underlying the reported volume of trade for Microsoft's stock (see Table 1) is: (0.5pts) Question 6 O pts Select the company in Table 1, that has the most efficient management at Year end 2018? (1pt) Microsoft Exxon Mobil Google Dillard's Dick's Sporting Goods Lowe's


