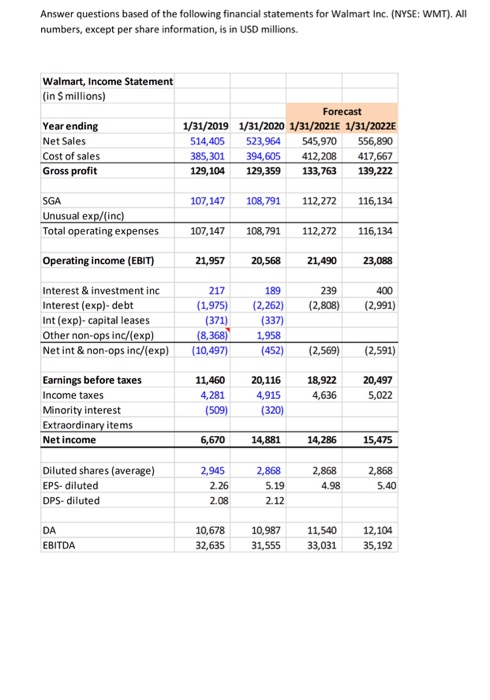
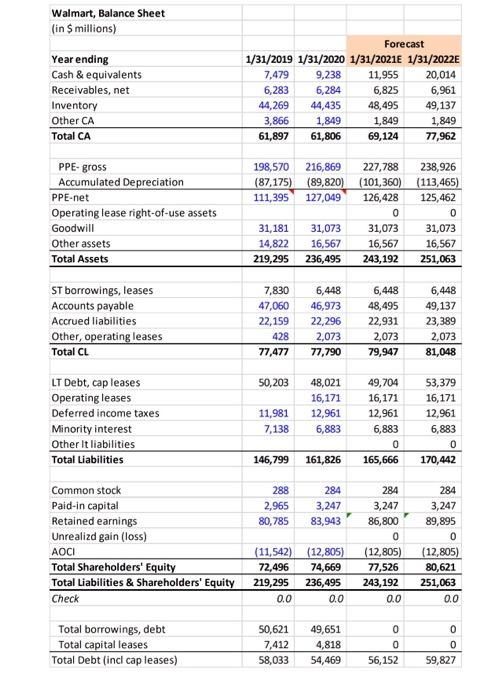
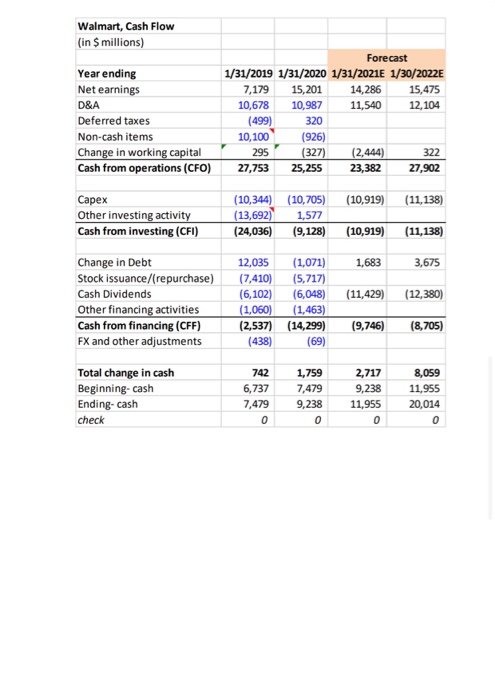
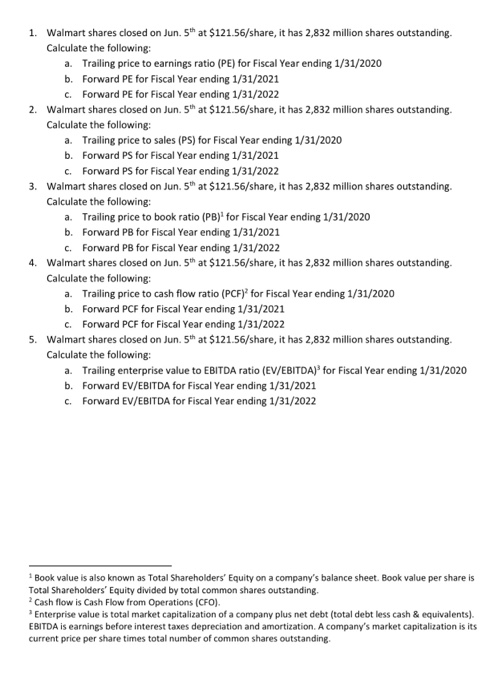
Answer questions based of the following financial statements for Walmart Inc. (NYSE: WMT). All numbers, except per share information, is in USD millions. Walmart, Income Statement (in $ millions) Year ending Net Sales Cost of sales Gross profit Forecast 1/31/2019 1/31/2020 1/31/2021E 1/31/2022E 514,405 523,964 545,970 556,890 385, 301 394,605 412,208 417,667 129,104 129,359 133,763 139,222 107,147 108,791 112,272 116,134 SGA Unusual exp/(inc) Total operating expenses Operating income (EBIT) 107,147 108,791 112,272 116,134 21,957 20,568 21,490 23,088 239 (2,808) 400 (2,991) Interest & investment inc Interest (exp)-debt Int (exp)- capital leases Other non-ops inc/exp) Net int & non-ops inc/exp) 217 (1,975) (371) (8,368) (10,497) 189 (2,262) (337) 1,958 (452) (2,569) (2,591) 11,460 4,281 (509) Earnings before taxes Income taxes Minority interest Extraordinary items Net income 20,116 4,915 (320) 18,922 4,636 20,497 5,022 6,670 14,881 14,286 15,475 Diluted shares (average) EPS-diluted DPS-diluted 2,945 2.26 2.08 2,868 5.19 2.12 2,868 4.98 2,868 5.40 DA EBITDA 10,678 32,635 10,987 31,555 11,540 33,031 12,104 35,192 Walmart, Balance Sheet (in 9 millions) Year ending Cash & equivalents Receivables, net Inventory Other CA Total CA Forecast 1/31/2019 1/31/2020 1/31/2021E 1/31/2022E 7,479 9,238 11,955 20,014 6,283 6,284 6,825 6,961 44,269 44,435 48,495 49,137 3,866 1,849 1,849 1,849 61,897 61,806 69,124 77,962 PPE-gross Accumulated Depreciation PPE-net Operating lease right-of-use assets Goodwill Other assets Total Assets 198,570 216,869 227,788 238,926 (87,175) (89,820) (101,360) (113,465) 111,395 127,049 126,428 125, 462 0 0 31,181 31,073 31,073 31,073 14,822 16,567 16,567 16,567 219,295 236,495 243,192 251,063 ST borrowings, leases Accounts payable Accrued liabilities Other, operating leases Total CL 7,830 47,060 22,159 428 77,477 6,448 46,973 22,296 2,073 77,790 6,448 48,495 22,931 2,073 79,947 6,448 49,137 23,389 2,073 81,048 50,203 LT Debt, cap leases Operating leases Deferred income taxes Minority interest Other It liabilities Total Liabilities 48,021 16,171 12,961 6,883 11,981 7,138 49,704 16,171 12,961 6,883 0 165,666 53,379 16,171 12,961 6,883 0 170,442 146,799 161,826 288 2,965 80,785 284 3,247 83,943 Common stock Paid-in capital Retained earnings Unrealizd gain (los) AOCI Total Shareholders' Equity Total Liabilities & Shareholders' Equity Check 284 3,247 86,800 0 (12,805) 77,526 243,192 0.0 284 3,247 89,895 0 (12,805) 80,621 251,063 0.0 (11,542) 72,496 219,295 0.0 (12,805) 74,669 236,495 0.0 Total borrowings, debt Total capital leases Total Debt (incl cap leases) 50,621 7,412 58,033 49,651 4,818 54,469 0 0 56,152 0 0 59,827 Walmart, Cash Flow (in $ millions) Year ending Net earnings D&A Deferred taxes Non-cash items Change in working capital Cash from operations (CFO) Forecast 1/31/2019 1/31/2020 1/31/2021E 1/30/2022E 7,179 15,201 14,286 15,475 10,678 10,987 11,540 12,104 (499) 320 10,100 (926) 295 (327) (2,444) 322 27,753 25,255 23,382 27,902 (10,919) (11,138) (10,344) (10,705) (13,692) 1,577 (24,036) (9,128) (10,919) (11,138) 1,683 3,675 Capex Other investing activity Cash from investing (CFI) Change in Debt Stock issuance/(repurchase) Cash Dividends Other financing activities Cash from financing (CFF) FX and other adjustments (11,429) (12,380) 12,035 (1,071) (7,410) (5,717) (6,102) (6,048) (1,060) (1,463) (2,537) (14,299) (438) (69) (9,746) (8,705) Total change in cash Beginning- cash Ending-cash check 742 6,737 7,479 0 1,759 7,479 9,238 0 2,717 9,238 11,955 0 8,059 11,955 20,014 0 1. Walmart shares closed on Jun. 5th at $121.56/share, it has 2,832 million shares outstanding- Calculate the following: a. Trailing price to earnings ratio (PE) for Fiscal Year ending 1/31/2020 b. Forward PE for Fiscal Year ending 1/31/2021 c. Forward PE for Fiscal Year ending 1/31/2022 2. Walmart shares closed on Jun. 5th at $121.56/share, it has 2,832 million shares outstanding. Calculate the following: a. Trailing price to sales (PS) for Fiscal Year ending 1/31/2020 b. Forward PS for Fiscal Year ending 1/31/2021 C. Forward PS for Fiscal Year ending 1/31/2022 3. Walmart shares closed on Jun. 5th at $121.56/share, it has 2,832 million shares outstanding. Calculate the following: a. Trailing price to book ratio (PB)' for Fiscal Year ending 1/31/2020 b. Forward PB for Fiscal Year ending 1/31/2021 C. Forward PB for Fiscal Year ending 1/31/2022 4. Walmart shares closed on Jun. 5th at $121.56/share, it has 2,832 million shares outstanding. Calculate the following: a. Trailing price to cash flow ratio (PCF) for Fiscal Year ending 1/31/2020 b. Forward PCF for Fiscal Year ending 1/31/2021 C. Forward PCF for Fiscal Year ending 1/31/2022 5. Walmart shares closed on Jun. 5th at $121.56/share, it has 2,832 million shares outstanding Calculate the following: a. Trailing enterprise value to EBITDA ratio (EV/EBITDA) for Fiscal Year ending 1/31/2020 b. Forward EV/EBITDA for Fiscal Year ending 1/31/2021 c. Forward EV/EBITDA for Fiscal Year ending 1/31/2022 Book value is also known as Total Shareholders' Equity on a company's balance sheet. Book value per share is Total Shareholders' Equity divided by total common shares outstanding. Cash flow is Cash Flow from Operations (CFO). Enterprise value is total market capitalization of a company plus net debt (total debt less cash & equivalents). EBITDA is earnings before interest taxes depreciation and amortization. A company's market capitalization is its current price per share times total number of common shares outstanding. Answer questions based of the following financial statements for Walmart Inc. (NYSE: WMT). All numbers, except per share information, is in USD millions. Walmart, Income Statement (in $ millions) Year ending Net Sales Cost of sales Gross profit Forecast 1/31/2019 1/31/2020 1/31/2021E 1/31/2022E 514,405 523,964 545,970 556,890 385, 301 394,605 412,208 417,667 129,104 129,359 133,763 139,222 107,147 108,791 112,272 116,134 SGA Unusual exp/(inc) Total operating expenses Operating income (EBIT) 107,147 108,791 112,272 116,134 21,957 20,568 21,490 23,088 239 (2,808) 400 (2,991) Interest & investment inc Interest (exp)-debt Int (exp)- capital leases Other non-ops inc/exp) Net int & non-ops inc/exp) 217 (1,975) (371) (8,368) (10,497) 189 (2,262) (337) 1,958 (452) (2,569) (2,591) 11,460 4,281 (509) Earnings before taxes Income taxes Minority interest Extraordinary items Net income 20,116 4,915 (320) 18,922 4,636 20,497 5,022 6,670 14,881 14,286 15,475 Diluted shares (average) EPS-diluted DPS-diluted 2,945 2.26 2.08 2,868 5.19 2.12 2,868 4.98 2,868 5.40 DA EBITDA 10,678 32,635 10,987 31,555 11,540 33,031 12,104 35,192 Walmart, Balance Sheet (in 9 millions) Year ending Cash & equivalents Receivables, net Inventory Other CA Total CA Forecast 1/31/2019 1/31/2020 1/31/2021E 1/31/2022E 7,479 9,238 11,955 20,014 6,283 6,284 6,825 6,961 44,269 44,435 48,495 49,137 3,866 1,849 1,849 1,849 61,897 61,806 69,124 77,962 PPE-gross Accumulated Depreciation PPE-net Operating lease right-of-use assets Goodwill Other assets Total Assets 198,570 216,869 227,788 238,926 (87,175) (89,820) (101,360) (113,465) 111,395 127,049 126,428 125, 462 0 0 31,181 31,073 31,073 31,073 14,822 16,567 16,567 16,567 219,295 236,495 243,192 251,063 ST borrowings, leases Accounts payable Accrued liabilities Other, operating leases Total CL 7,830 47,060 22,159 428 77,477 6,448 46,973 22,296 2,073 77,790 6,448 48,495 22,931 2,073 79,947 6,448 49,137 23,389 2,073 81,048 50,203 LT Debt, cap leases Operating leases Deferred income taxes Minority interest Other It liabilities Total Liabilities 48,021 16,171 12,961 6,883 11,981 7,138 49,704 16,171 12,961 6,883 0 165,666 53,379 16,171 12,961 6,883 0 170,442 146,799 161,826 288 2,965 80,785 284 3,247 83,943 Common stock Paid-in capital Retained earnings Unrealizd gain (los) AOCI Total Shareholders' Equity Total Liabilities & Shareholders' Equity Check 284 3,247 86,800 0 (12,805) 77,526 243,192 0.0 284 3,247 89,895 0 (12,805) 80,621 251,063 0.0 (11,542) 72,496 219,295 0.0 (12,805) 74,669 236,495 0.0 Total borrowings, debt Total capital leases Total Debt (incl cap leases) 50,621 7,412 58,033 49,651 4,818 54,469 0 0 56,152 0 0 59,827 Walmart, Cash Flow (in $ millions) Year ending Net earnings D&A Deferred taxes Non-cash items Change in working capital Cash from operations (CFO) Forecast 1/31/2019 1/31/2020 1/31/2021E 1/30/2022E 7,179 15,201 14,286 15,475 10,678 10,987 11,540 12,104 (499) 320 10,100 (926) 295 (327) (2,444) 322 27,753 25,255 23,382 27,902 (10,919) (11,138) (10,344) (10,705) (13,692) 1,577 (24,036) (9,128) (10,919) (11,138) 1,683 3,675 Capex Other investing activity Cash from investing (CFI) Change in Debt Stock issuance/(repurchase) Cash Dividends Other financing activities Cash from financing (CFF) FX and other adjustments (11,429) (12,380) 12,035 (1,071) (7,410) (5,717) (6,102) (6,048) (1,060) (1,463) (2,537) (14,299) (438) (69) (9,746) (8,705) Total change in cash Beginning- cash Ending-cash check 742 6,737 7,479 0 1,759 7,479 9,238 0 2,717 9,238 11,955 0 8,059 11,955 20,014 0 1. Walmart shares closed on Jun. 5th at $121.56/share, it has 2,832 million shares outstanding- Calculate the following: a. Trailing price to earnings ratio (PE) for Fiscal Year ending 1/31/2020 b. Forward PE for Fiscal Year ending 1/31/2021 c. Forward PE for Fiscal Year ending 1/31/2022 2. Walmart shares closed on Jun. 5th at $121.56/share, it has 2,832 million shares outstanding. Calculate the following: a. Trailing price to sales (PS) for Fiscal Year ending 1/31/2020 b. Forward PS for Fiscal Year ending 1/31/2021 C. Forward PS for Fiscal Year ending 1/31/2022 3. Walmart shares closed on Jun. 5th at $121.56/share, it has 2,832 million shares outstanding. Calculate the following: a. Trailing price to book ratio (PB)' for Fiscal Year ending 1/31/2020 b. Forward PB for Fiscal Year ending 1/31/2021 C. Forward PB for Fiscal Year ending 1/31/2022 4. Walmart shares closed on Jun. 5th at $121.56/share, it has 2,832 million shares outstanding. Calculate the following: a. Trailing price to cash flow ratio (PCF) for Fiscal Year ending 1/31/2020 b. Forward PCF for Fiscal Year ending 1/31/2021 C. Forward PCF for Fiscal Year ending 1/31/2022 5. Walmart shares closed on Jun. 5th at $121.56/share, it has 2,832 million shares outstanding Calculate the following: a. Trailing enterprise value to EBITDA ratio (EV/EBITDA) for Fiscal Year ending 1/31/2020 b. Forward EV/EBITDA for Fiscal Year ending 1/31/2021 c. Forward EV/EBITDA for Fiscal Year ending 1/31/2022 Book value is also known as Total Shareholders' Equity on a company's balance sheet. Book value per share is Total Shareholders' Equity divided by total common shares outstanding. Cash flow is Cash Flow from Operations (CFO). Enterprise value is total market capitalization of a company plus net debt (total debt less cash & equivalents). EBITDA is earnings before interest taxes depreciation and amortization. A company's market capitalization is its current price per share times total number of common shares outstanding