

Question
Answer questions below using the following attached documents. 1. After evaluating the acquisition based on the DCF analysis of both the expected and pessimistic scenarios,
Answer questions below using the following attached documents.
1. After evaluating the acquisition based on the DCF analysis of both the expected and pessimistic scenarios, should Tim Harris offer $120 million for 100% of Landmarks equity? For answering this question, ignore the information about the financing alternatives. That is, use only the information provided in Exhibits 13, and the DCF analysis provided in Tables 16.
2. Suppose Harris decides to go ahead with the acquisition. He is considering two financing alternatives as described in the Deal financing section of the case: 100% debt financing; or a mix of debt financing and equity financing. Pro forma financial statements of the combined firm are provided in Tables 89 for each financing option.
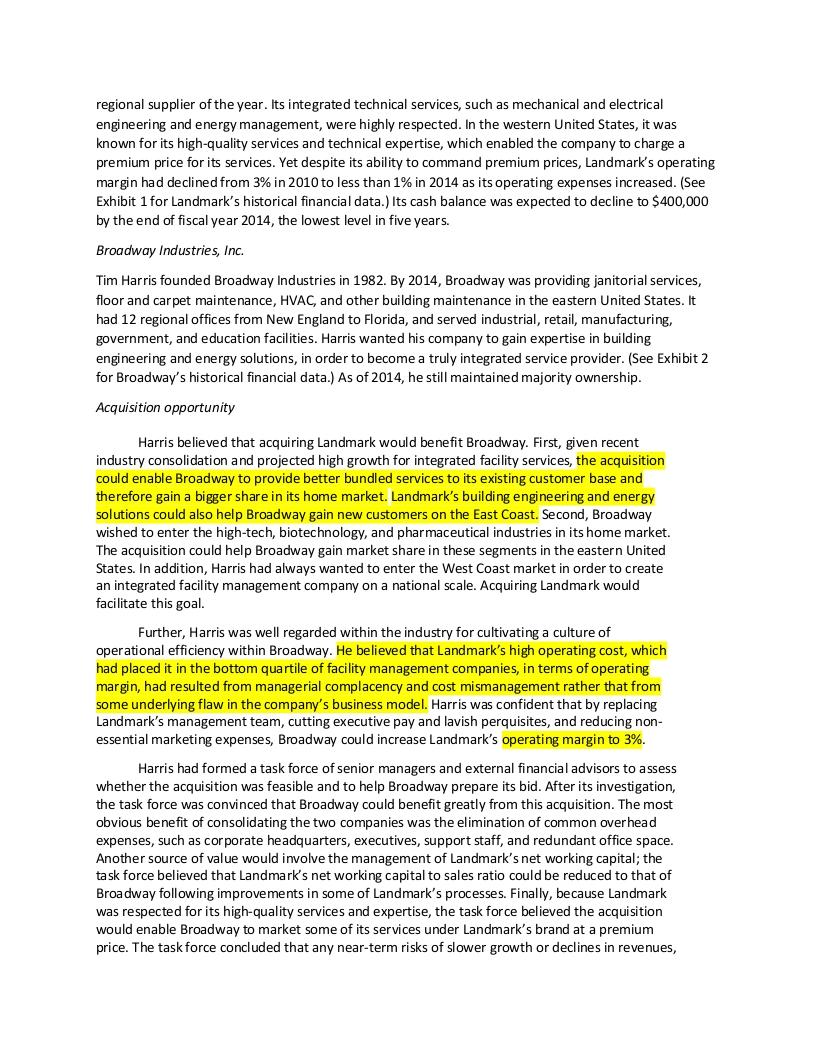
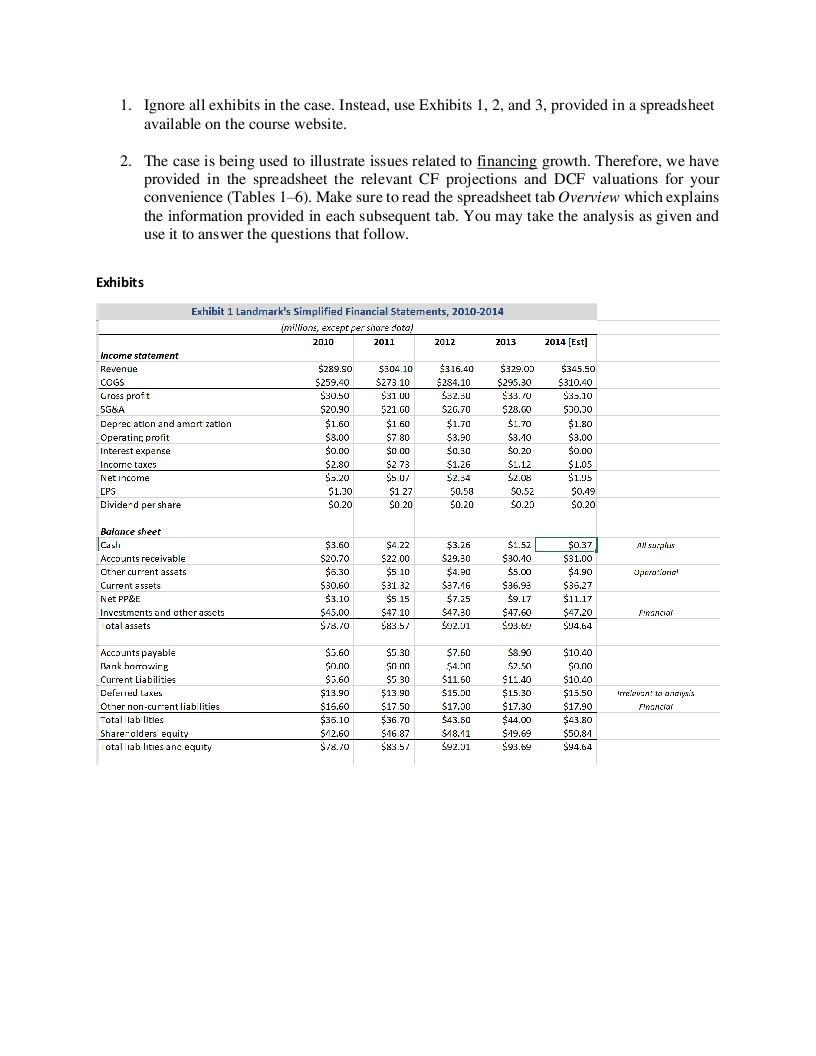
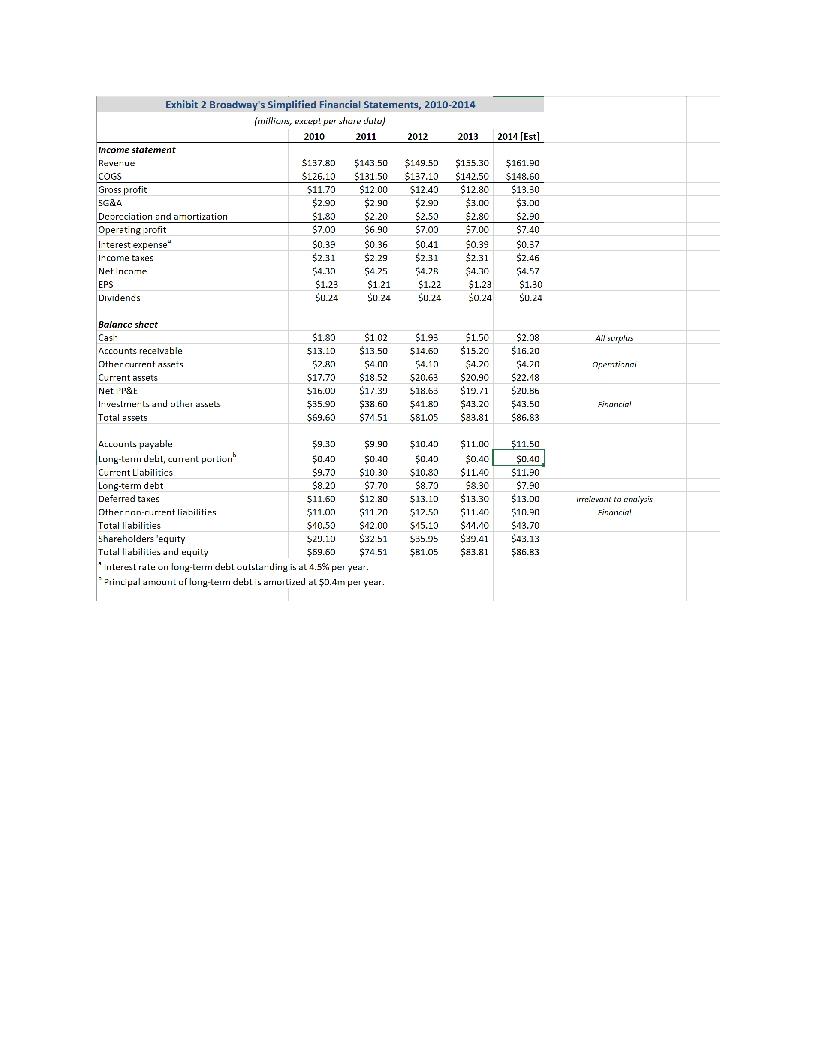
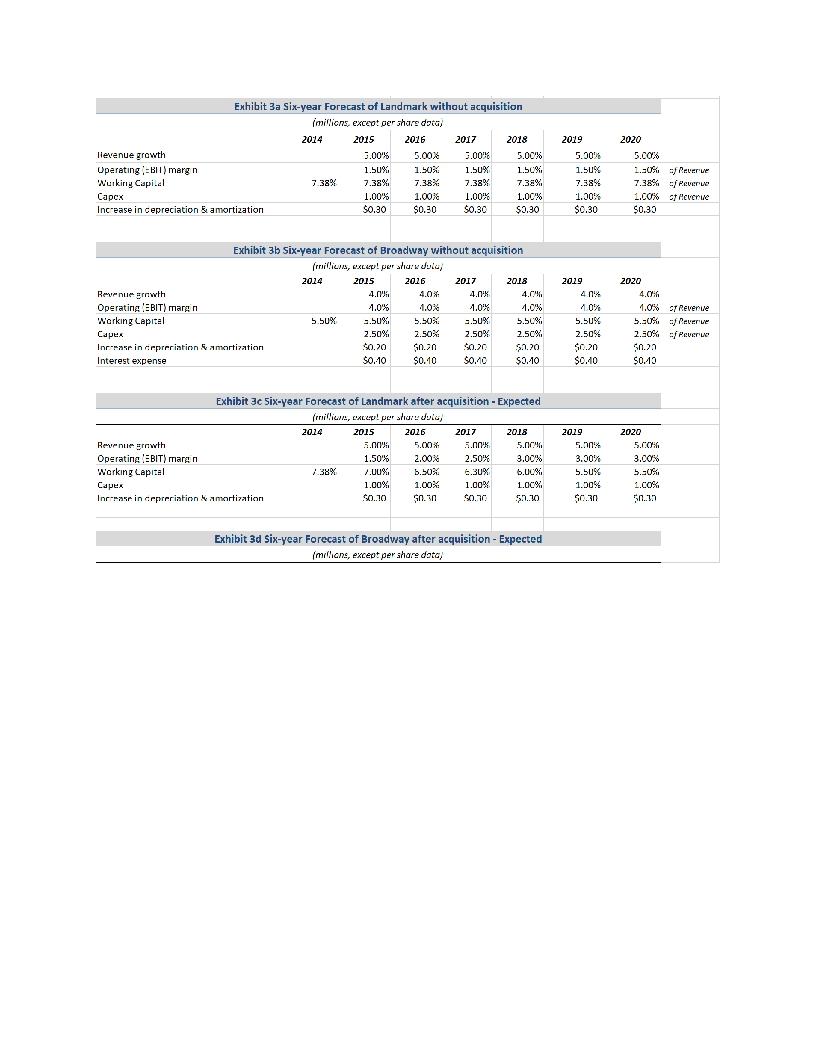
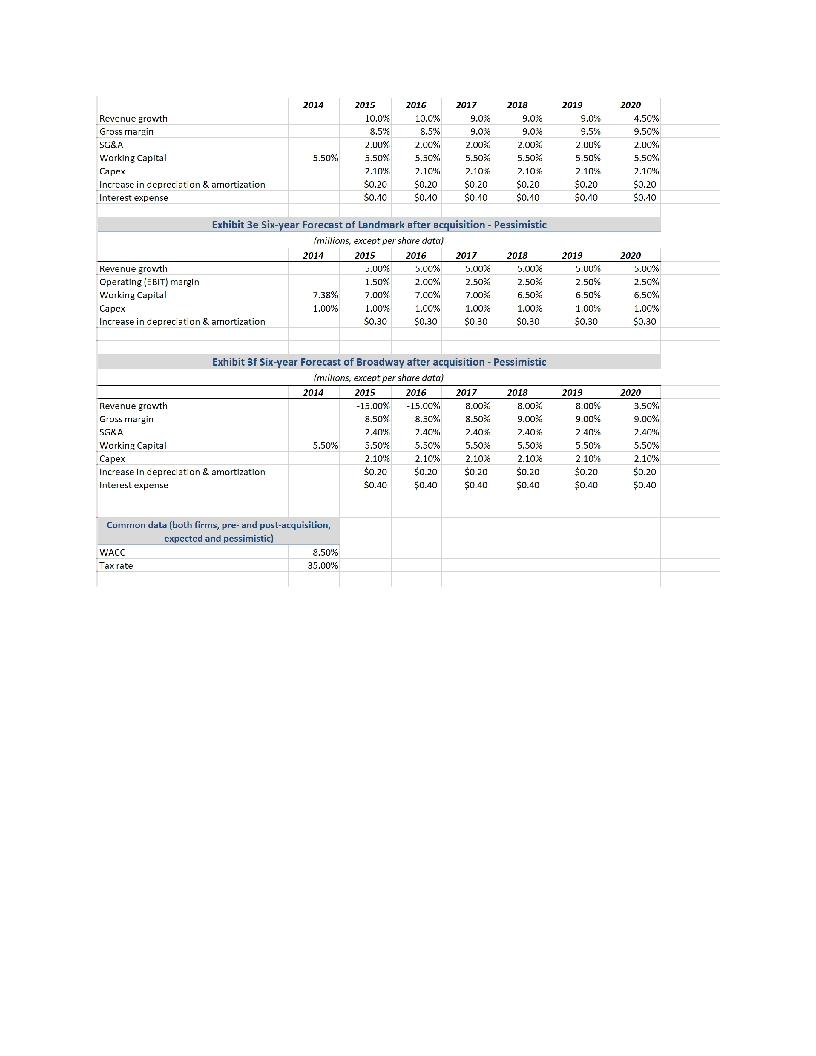
Landmark Facility Solutions In September 2014, Tim Harris, CEO and president of Broadway Industries, a facility-services company based in Newark, New Jersey, sat in his office considering whether he should acquire Landmark Facility Solutions, a facility-services company based in Sacramento, California. He also was trying to decide whether to finance the acquisition entirely with debt or with a combination of equity and debt. Earlier that week, Harris had learned that, although willing to sell their company to Broadway, Landmark's capital providers had stated they would accept no less than $120 million. Harris was excited about this opportunity, which he believed could be very valuable for Broadway. Nonetheless, two of Broadway's board members strongly opposed this acquisition. Despite his enthusiasm, Harris was not sure how much Landmark was worth to Broadway, or how Broadway should finance the acquisition. He knew that he had to decide now, or he would miss this chance to make Broadway a truly integrated facility- services provider. Industry Background In 2013, organizations in the United States spent $120 billion on facility management. A typical facility manager provided comprehensive facility services, which included janitorial solutions, HVAC, commercial cleaning, facility engineering, energy solutions, landscaping, parking, and security, through stand-alone or integrated solutions. The industry comprised a few large integrated companies and many small, private players with specific industry or regional expertise, and was highly fragmented and competitive. This environment represented an opportunity for large companies that operated in multiple market segments. These firms began to diversify their services, offering bundled or integrated services to clients. They did so for two reasons. First, they wanted to use economies of scale to achieve cost reductions. Second, they wanted to offer a compelling value proposition that would enable them to realize premium pricing. Large corporate clients favored bundled contracts because they preferred to deal with one service provider that satisfied all of their needs. By bundling contracts, facility managers could improve client relationships, secure larger contracts, and increase brand recognition. Further, by diversifying services, providers expanded their expertise in specific industries (e.g., hospital, airport), often through horizontal acquisitions of players that specialized in a desired area. The integrated facility- services industry had experienced steady growth over the previous decade, and the demand for its services was expected to grow at 6% annually between 2014 and 2016. In contrast, the market for single-service contracts was forecasted to grow at 4% annually. Landmark Facility Solutions Landmark Facility Solutions was founded in 1956 as a regional janitorial services provider to commercial facilities in the Sacramento area. It grew quickly over the next three decades. By the late 2000s, it had become a large integrated provider to commercial customers. It specialized in building engineering and energy solutions, janitorial and commercial cleaning, and other general building maintenance and management. It serviced corporate campuses, headquarters, and research facilities for companies in the pharmaceutical, medical, high-tech, and consumer products sectors. By early 2014, Landmark Facility Solutions employed more than 5,000 employees and serviced more than 300 million square feet. It had more than 20 regional offices, in California, Arizona, Oregon, Washington, and British Columbia. Its major clients included large hospitals and several Fortune 500 biotechnology and pharmaceutical companies. Landmark had won several awards and been named regional supplier of the year. Its integrated technical services, such as mechanical and electrical engineering and energy management, were highly respected. In the western United States, it was known for its high-quality services and technical expertise, which enabled the company to charge a premium price for its services. Yet despite its ability to command premium prices, Landmark's operating margin had declined from 3% in 2010 to less than 1% in 2014 as its operating expenses increased. (See Exhibit 1 for Landmark's historical financial data.) Its cash balance was expected to decline to $400,000 by the end of fiscal year 2014, the lowest level in five years. Broadway Industries, Inc. Tim Harris founded Broadway Industries in 1982. By 2014, Broadway was providing janitorial services, floor and carpet maintenance, HVAC, and other building maintenance in the eastern United States. It had 12 regional offices from New England to Florida, and served industrial, retail, manufacturing, government, and education facilities. Harris wanted his company to gain expertise in building engineering and energy solutions, in order to become a truly integrated service provider. (See Exhibit 2 for Broadway's historical financial data.) As of 2014, he still maintained majority ownership. Acquisition opportunity Harris believed that acquiring Landmark would benefit Broadway. First, given recent industry consolidation and projected high growth for integrated facility services, the acquisition could enable Broadway to provide better bundled services to its existing customer base and therefore gain a bigger share in its home market. Landmark's building engineering and energy solutions could also help Broadway gain new customers on the East Coast. Second, Broadway wished to enter the high-tech, biotechnology, and pharmaceutical industries in its home market. The acquisition could help Broadway gain market share in these segments in the eastern United States. In addition, Harris had always wanted to enter the West Coast market in order to create an integrated facility management company on a national scale. Acquiring Landmark would facilitate this goal. Further, Harris was well regarded within the industry for cultivating a culture of operational efficiency within Broadway. He believed that Landmark's high operating cost, which had placed it in the bottom quartile of facility management companies, in terms of operating margin, had resulted from managerial complacency and cost mismanagement rather that from some underlying flaw in the company's business model. Harris was confident that by replacing Landmark's management team, cutting executive pay and lavish perquisites, and reducing non- essential marketing expenses, Broadway could increase Landmark's operating margin to 3%. Harris had formed a task force of senior managers and external financial advisors to assess whether the acquisition was feasible and to help Broadway prepare its bid. After its investigation, the task force was convinced that Broadway could benefit greatly from this acquisition. The most obvious benefit of consolidating the two companies was the elimination of common overhead expenses, such as corporate headquarters, executives, support staff, and redundant office space. Another source of value would involve the management of Landmark's net working capital; the task force believed that Landmark's net working capital to sales ratio could be reduced to that of Broadway following improvements in some of Landmark's processes. Finally, because Landmark was respected for its high-quality services and expertise, the task force believed the acquisition would enable Broadway to market some of its services under Landmark's brand at a premium price. The task force concluded that any near-term risks of slower growth or declines in revenues, due to the premium pricing strategy, would be compensated for by the expected improvements in gross profit margin. It laid out the following projections. The task force expected Landmark's revenue to grow at 5% per year from 2014 to 2020 and 4% per year thereafter, regardless of whether the acquisition occurred. It believed that, under Broadway's management, Landmark's operating (EBIT)margin could increase to 1.5% in 2015, 2% in 2016, 2.5% in 2017, and 3% thereafter, compared to 1.5% each year if there was no acquisition. By actively managing net working capital, non-cash net working capital as a percentage of sales was expected to decline to 7% in 2015, 6.5% in 2016, 6.3% in 2017, 6% in 2018, and 5.5% thereafter, rather than 7.38% under the old management. Capital expenditures were expected to remain at 1% of annual sales, and depreciation would increase by $300,000 per year in the foreseeable future, regardless of the acquisition. After 2020, Landmark's projected free cash flows were expected to grow at 4% annually, regardless of the acquisition. See Exhibits 3a and 3c for the five-year forecasts of Landmark with and without the acquisition, respectively. Without the acquisition, Broadway's revenues were expected to grow at an annual rate of 4% till 2020. The operating (EBIT) margin was expected to be a steady 4%, working capital 5.5% and cap-ex 2.5%, all percentage of revenues. Annual increase in depreciation was assumed to be a constant $200,000. After 2020, free cash flows were assumed to grow at 4% annually. See Exhibit 3b for the five-year forecasts of Broadway without the acquisition. The task force suggested that with the new premium pricing strategy, Broadway's revenue would decline by 10% a year in both 2015 and 2016, but would then grow at 9% a year for three years, and 4.5% thereafter. It is expected that the premium pricing strategy would improve Broadway's gross margin' to 8.5% in 2015 and 2016,9% in 2017 and 2018, and 9.5% thereafter. The task force also expected that SG&A as a percentage of revenue would remain constant at 2%, starting in 2015. Capital expenditure would be reduced to 2.1% of annual sales. Depreciation would grow by $200,000 a year. After 2020, free cash flows were assumed to grow at 4.5% annually. See Exhibit 3d for the five-year forecasts of Broadway if the acquisition takes place. Nonetheless, the task force had doubts about its assumptions regarding management and net working capital. Nor was it certain whether Broadway's account team and financial officers could manage the larger, more complex organization. Managing a combined entity double the size Broadway, with coast-to-coast operations, would be challenging. The premium pricing strategy might not work, and forecasted increases in operating margins might be too optimistic. In a pessimistic scenario, Landmark's net working capital would be 7% of sales from 2015 to 2017 and 6.5% in 2018 and thereafter. Its operating margin would reach a steady state of 2.5% by 2017 and thereafter. The premium pricing strategy might result in a 15% decline in revenue a year for Broadway, in 2015 and 2016, before it would grow again at 8% a year for three years, and at 3.5% a year thereafter - lower than the long-term growth rate of Broadway, without the acquisition. Broadway's gross margin would be 8.5% from 2015 to 2017, and 9% in 2018 and thereafter. SG&A as a percentage of sales would be 2.4% in 2015 and thereafter. All other projections would be the same as in the expected scenario. For valuation purposes, it was assumed that the acquisition will be completed by 2014 year-end. All valuations are therefore done as of end of 2014, under the assumption that 2015 will be the first year. 2 Gross margin = Gross profit as % of Revenue, where Gross profit = Revenue - COGS. Financial assets and liabilities of both firms were valued at book value for the purpose of evaluating the acquisition. The market reaction to the proposed acquisition had been mixed. Some investment banks reacted negatively to it, citing concern about whether Broadway could manage the combined business and effectively implement the proposed cost-cutting measures. Some of Broadway's board members and shareholders expressed similar views. Further, the board was unconvinced about the new pricing strategy and service model, and improvements to working capital. However, Stanley Investment Company, a major investment bank, was confident that the acquisition would benefit both companies and that financing for the acquisition could be arranged. See Exhibits 3e and 3f for the pessimistic five-year forecasts of Landmark and Broadway, respectively. The weighted average cost of capital for all calculations was estimated to be 8.5%; the tax rate used for valuation was 35%. 1. Ignore all exhibits in the case. Instead, use Exhibits 1, 2, and 3, provided in a spreadsheet available on the course website. 2. The case is being used to illustrate issues related to financing growth. Therefore, we have provided in the spreadsheet the relevant CF projections and DCF valuations for your convenience (Tables 1-6). Make sure to read the spreadsheet tab Overview which explains the information provided in each subsequent tab. You may take the analysis as given and use it to answer the questions that follow. Exhibits 2014 [Est] Exhibit 1 Landmark's Simplified Financial Statements, 2010-2014 milions, except per share data! 2010 2011 2012 2013 Income statement Revenue $289.50 $304.10 $316.40 $329.00 COGS $259,40 $273 10 $284.10 $295.30 Gross proft $30.50 531 UU 552.50 $35.0 5G&A $20.90 521 GO $26.70 $28.60 Deprecation and amart zation $1.60 $1.60 $1.70 $1.70 Operating profit $8.00 $7 80 $3.90 $3.110 Interest expense $0.00 $0.00 $0.30 $0.20 Incornic taxes $2.80 $2 73 $1.26 $1.12 Net income $2.20 $5.0/ $2.34 $2.05 CPS $1.30 $1 27 50.58 $0.52 Divided per share $0.20 $0.20 $0.20 $0.23 $345.50 $310.40 $35.10 $30.30 $1.80 $3.00 $0.00 $1.05 $105 $0.49 $0.20 All surplus Uporational Balance sheet Carli Accounts receivable Other current assets Current assets Net PP&E Investments and other assets otal assets $3.60 $20.70 $5.30 $30.60 $3.10 $45.00 $78.70 $422 $22.00 $5.10 $31 32 $5.15 $47 10 $83.57 $3.26 $29.30 $4.90 $37.16 $7.25 $47.30 $22.01 $1.52 $30.10 $5.00 $36.98 $9.17 $47.60 $93.0 $0.37 $31.00 $4.90 $35.27 11.17 $47.20 $94.64 Financial Accounts payable Link homewire Current Liabilities Deferred Laxus Other non-current liab lities Total lab litles Shareholders equity otal ab lities and equity $3.60 $0.00 $3.60 $13.90 $15.60 $35.10 $12.60 $18.70 $5.30 $0.00 $5.30 $13.90 $17 50 $36.70 $16.87 583.5/ $7.50 $4.00 $11.60 $15.50 $17.30 $43.50 $ $18.11 $42.01 $8.90 $2.50 $11.40 $15.30 $17.30 $44.00 $19.69 $93.64 $10.40 $0.00 $10.40 $15.50 $17.90 $43.80 $50.81 $94.64 irrelevant to any's Financial 2011 (Est1 Exhibit 2 Broadway's Simplified Financial Statements, 2010-2014 muillis, excep! perolulu) 2010 2011 2012 2013 Income statement Revenue $137.80 $143.50 $149.50 $155.30 COGS $_26.10 $131 50 $137.10 $142.50 Gross profit $11.79 $12 00 $12.40 $12.80 SG24 $2.90 $2.90 $2.99 $3.00 Dcorcciation and a mortization $1.80 $2 20 $2.50 $2.80 Operating profit $7.00 $6.90 $7.00 $7.00 Ieterest expense" $0.39 $0 36 $0.41 $0.39 income taxes $2.31 $2.29 $2.31 $2.31 Net nene 54.10 $425 54.75 $4.70 EPS $1.23 $1 21 $1.22 $1.23 Dividenes 50.24 SU 24 50.24 $0.24 $161.90 $148.60 $13.30 $3.00 $2.00 $7.40 $0.37 $2.46 54.57 $1.30 $0.24 $ 41 suruus Balance sheet Cas Accounts receivable Other current Assets Current assets Net & til $1.83 $13.10 52.89 $17.73 $16.00 $35.90 $69.63 $102 $13.50 $4.00 $18 52 $1.39 $38.60 $74.51 $1.99 $14.60 54.13 $20.63 $18.63 $41.89 $ $81.05 $1.50 $15.20 $4.20 $20.90 $19./1 $43.20 $83.81 $2.08 $16.20 54.70 $22.18 520.56 $43.50 $86.83 - lrII | Fisarcie! Total sets 4.Lounla payablu 59.35 $9.90 Lung LedLI, current portion $0.40 $0.40 Current Labilitics $9.79 $110.30 Long-term debt $8.20 $7 70 Deferred takes $11.60 $12.80 Other-anr.ment lisilities 511.09 $11.20 Total abilities $10.53 $42.00 shareholders equity $29.10 $32.51 Tulallabillies and equily $59.60 $ $74.51 uleresirale oli lung lemn dubloulslarding is al 4.5% per year. Print palamull. ullung-lerri debl sarru Lixed al $0.4m per year. $10.45 $0.40 $10.80 $8.79 $13.10 $12.50 $15.10 $55.55 $31.05 $11.00 $0.40 $11.40 $8.30 $13.30 $11.40 $.11.10 $29.41 $83.81 $11.50 $0.40 $11.90 $7.90 $13.00 510.9 $13.70 $43.13 586.33 irrelevant to crysis Siconca 2020 Exhibit 3a Six-year Forecast of Landmark without acquisition millions, except oer share daca 2014 2015 2016 2017 2018 lievenue growth 3.00% 5.00% 3.00% 5.00% Operating = 511) margin 1.50% 1.50X 1.50X 1.50% Wurking Capi.al 7.38% 7.38%. 7.38% 7.38% 7.38% Capex 1.00% 1.00% 1.00% 1.00% Increase in cepreciation amortization & $0.30 $0.30 $0.30 $0.30 2019 5.30 1.5UX 7.38% 1.00% $0.30 5.00% 1.30%) Revere 7.38% - Pevere 1.00% slevenue $0.33 Exhibit 3b Six-year Forecast of Broadway without acquisition (millis, excep! perahur dulu) 2014 2015 2026 2017 2018 Revenue grwth 4.04 4.0" 4.CH Operating EBIT)maran 4.0% 1.0% 1.0% 1.0% Working lapital 5.50% 9.50%. 9.50% 5.50% Capex 2.50% 2.50% 2.50% 2.50% Increase in cepreciation & amortization $0.20 $0.20 $0.20 $2.20 Interest expense $0.-10 $0.10 $0.70 $3.10 2019 40.4 10% 5.50% 2.50% $0.20 $0.10 2020 4.06 1.0% ST Revenue 5.0% verve 2.50% / Pevere $0.2 $0.13 Exhibit 3c Six-year Forecast of Landmark after acquisition - Expected (riis, cxcu!per sur le 2014 2015 2016 2017 2018 Revenue growth 5.00 5.00x 5.00'X 5.000 Operating EBIT)maran 1.50% 2.00% 2.50% 3.00% Working capital 2.38% /.00% 5.50X 6.30% b.00% Capex 1.00% 1.00% 1.00% Increase in cepreciation amortization $0.10 $0. $0.90 5.10 2019 5.00% 3.30% 5.50% 1.00% $0.30 2020 5.00 3.00% 5.-0% 1.COM 50.1 1.OCX Exhibit 3d Six-year Forecast of Broadway after acquisition - Expected imillians, except per shant data) 2014 201a Revenue growth Goss masin SG&A Viorking Capital Cape Increase in coprecation & amortization Interest expense 9.50% 2015 10.0% 8.5% 2.00% 5.50% 7.111 $0.20 $0.40 2016 10.6% 8.5% 2.CCX 5.50% 7.10 $0.20 $0.10 2017 9.06 9.0% 2.00% 5.50%: 2.10% $0 20 $0.10 2019 9.0 9.5% 2.00% 5.50% 2.1054 $0.20 $0.70 9.08 9.0% 2.00% 5.50% 7.104 $0.20 $0.10 2020 4.50% 9.50% 2.00% 5.50% 2.1046 $3.20 $3.10 5.50% 2020 Exhibit 3e Six-year Forecast of Landmark after acquisition - Pessimistic milions, except oer share data) 2014 2015 2016 2017 2018 Revenue growth J.00 5.00% Operating !EBIT) margin 1.50% 2.00% 2.50% 2.50% Vilunking Capital 7.38%. 7.00% 7.00% 7.00% 6.50% Capcx 1.00% 1.00% 1.00% 1.00 1.00 Increase in ceprecution & amortization $0.30 $0.30 $0.30 $0.30 2019 UU% 2.50% 6.50% 100% $0.30 2.50%. 6.50% 1.00% $3.30 Exhibit 3f Six-year Forecast of Broadway after acquisition - Pessimistic Imiilions, except per share data) 2014 2015 2016 2017 2018 Revenue growth -13.00% -15.00% 8.00% 8.00% Guruin 8.50% 8.50% 8.50%: 9.00% 5GKA 7.401"} 7.40% 7.40* Verkin Capital 5.50% 5.50% 5.50% 5.50% 5.50% Capex 2.10' 2.10% 2.10% 2.10% Increase in ceprecat on & amortization $0.20 $0.20 $0.20 $0.20 Interest expense $0.40 $0.40 $0.40 $0.40 7.4016 2019 8.00 9.00% 74044 5 50% 2 10% $0.20 $0.40 2020 3.50%, 9.00% 7.4074 5.50% 2.10% $0.20 $0.40 Cummion dala (both firrris, pre- and post-acquisition, cxpccted and pessimistic) WACC 8.50% Fax rate 35.00% Landmark Facility Solutions In September 2014, Tim Harris, CEO and president of Broadway Industries, a facility-services company based in Newark, New Jersey, sat in his office considering whether he should acquire Landmark Facility Solutions, a facility-services company based in Sacramento, California. He also was trying to decide whether to finance the acquisition entirely with debt or with a combination of equity and debt. Earlier that week, Harris had learned that, although willing to sell their company to Broadway, Landmark's capital providers had stated they would accept no less than $120 million. Harris was excited about this opportunity, which he believed could be very valuable for Broadway. Nonetheless, two of Broadway's board members strongly opposed this acquisition. Despite his enthusiasm, Harris was not sure how much Landmark was worth to Broadway, or how Broadway should finance the acquisition. He knew that he had to decide now, or he would miss this chance to make Broadway a truly integrated facility- services provider. Industry Background In 2013, organizations in the United States spent $120 billion on facility management. A typical facility manager provided comprehensive facility services, which included janitorial solutions, HVAC, commercial cleaning, facility engineering, energy solutions, landscaping, parking, and security, through stand-alone or integrated solutions. The industry comprised a few large integrated companies and many small, private players with specific industry or regional expertise, and was highly fragmented and competitive. This environment represented an opportunity for large companies that operated in multiple market segments. These firms began to diversify their services, offering bundled or integrated services to clients. They did so for two reasons. First, they wanted to use economies of scale to achieve cost reductions. Second, they wanted to offer a compelling value proposition that would enable them to realize premium pricing. Large corporate clients favored bundled contracts because they preferred to deal with one service provider that satisfied all of their needs. By bundling contracts, facility managers could improve client relationships, secure larger contracts, and increase brand recognition. Further, by diversifying services, providers expanded their expertise in specific industries (e.g., hospital, airport), often through horizontal acquisitions of players that specialized in a desired area. The integrated facility- services industry had experienced steady growth over the previous decade, and the demand for its services was expected to grow at 6% annually between 2014 and 2016. In contrast, the market for single-service contracts was forecasted to grow at 4% annually. Landmark Facility Solutions Landmark Facility Solutions was founded in 1956 as a regional janitorial services provider to commercial facilities in the Sacramento area. It grew quickly over the next three decades. By the late 2000s, it had become a large integrated provider to commercial customers. It specialized in building engineering and energy solutions, janitorial and commercial cleaning, and other general building maintenance and management. It serviced corporate campuses, headquarters, and research facilities for companies in the pharmaceutical, medical, high-tech, and consumer products sectors. By early 2014, Landmark Facility Solutions employed more than 5,000 employees and serviced more than 300 million square feet. It had more than 20 regional offices, in California, Arizona, Oregon, Washington, and British Columbia. Its major clients included large hospitals and several Fortune 500 biotechnology and pharmaceutical companies. Landmark had won several awards and been named regional supplier of the year. Its integrated technical services, such as mechanical and electrical engineering and energy management, were highly respected. In the western United States, it was known for its high-quality services and technical expertise, which enabled the company to charge a premium price for its services. Yet despite its ability to command premium prices, Landmark's operating margin had declined from 3% in 2010 to less than 1% in 2014 as its operating expenses increased. (See Exhibit 1 for Landmark's historical financial data.) Its cash balance was expected to decline to $400,000 by the end of fiscal year 2014, the lowest level in five years. Broadway Industries, Inc. Tim Harris founded Broadway Industries in 1982. By 2014, Broadway was providing janitorial services, floor and carpet maintenance, HVAC, and other building maintenance in the eastern United States. It had 12 regional offices from New England to Florida, and served industrial, retail, manufacturing, government, and education facilities. Harris wanted his company to gain expertise in building engineering and energy solutions, in order to become a truly integrated service provider. (See Exhibit 2 for Broadway's historical financial data.) As of 2014, he still maintained majority ownership. Acquisition opportunity Harris believed that acquiring Landmark would benefit Broadway. First, given recent industry consolidation and projected high growth for integrated facility services, the acquisition could enable Broadway to provide better bundled services to its existing customer base and therefore gain a bigger share in its home market. Landmark's building engineering and energy solutions could also help Broadway gain new customers on the East Coast. Second, Broadway wished to enter the high-tech, biotechnology, and pharmaceutical industries in its home market. The acquisition could help Broadway gain market share in these segments in the eastern United States. In addition, Harris had always wanted to enter the West Coast market in order to create an integrated facility management company on a national scale. Acquiring Landmark would facilitate this goal. Further, Harris was well regarded within the industry for cultivating a culture of operational efficiency within Broadway. He believed that Landmark's high operating cost, which had placed it in the bottom quartile of facility management companies, in terms of operating margin, had resulted from managerial complacency and cost mismanagement rather that from some underlying flaw in the company's business model. Harris was confident that by replacing Landmark's management team, cutting executive pay and lavish perquisites, and reducing non- essential marketing expenses, Broadway could increase Landmark's operating margin to 3%. Harris had formed a task force of senior managers and external financial advisors to assess whether the acquisition was feasible and to help Broadway prepare its bid. After its investigation, the task force was convinced that Broadway could benefit greatly from this acquisition. The most obvious benefit of consolidating the two companies was the elimination of common overhead expenses, such as corporate headquarters, executives, support staff, and redundant office space. Another source of value would involve the management of Landmark's net working capital; the task force believed that Landmark's net working capital to sales ratio could be reduced to that of Broadway following improvements in some of Landmark's processes. Finally, because Landmark was respected for its high-quality services and expertise, the task force believed the acquisition would enable Broadway to market some of its services under Landmark's brand at a premium price. The task force concluded that any near-term risks of slower growth or declines in revenues, due to the premium pricing strategy, would be compensated for by the expected improvements in gross profit margin. It laid out the following projections. The task force expected Landmark's revenue to grow at 5% per year from 2014 to 2020 and 4% per year thereafter, regardless of whether the acquisition occurred. It believed that, under Broadway's management, Landmark's operating (EBIT)margin could increase to 1.5% in 2015, 2% in 2016, 2.5% in 2017, and 3% thereafter, compared to 1.5% each year if there was no acquisition. By actively managing net working capital, non-cash net working capital as a percentage of sales was expected to decline to 7% in 2015, 6.5% in 2016, 6.3% in 2017, 6% in 2018, and 5.5% thereafter, rather than 7.38% under the old management. Capital expenditures were expected to remain at 1% of annual sales, and depreciation would increase by $300,000 per year in the foreseeable future, regardless of the acquisition. After 2020, Landmark's projected free cash flows were expected to grow at 4% annually, regardless of the acquisition. See Exhibits 3a and 3c for the five-year forecasts of Landmark with and without the acquisition, respectively. Without the acquisition, Broadway's revenues were expected to grow at an annual rate of 4% till 2020. The operating (EBIT) margin was expected to be a steady 4%, working capital 5.5% and cap-ex 2.5%, all percentage of revenues. Annual increase in depreciation was assumed to be a constant $200,000. After 2020, free cash flows were assumed to grow at 4% annually. See Exhibit 3b for the five-year forecasts of Broadway without the acquisition. The task force suggested that with the new premium pricing strategy, Broadway's revenue would decline by 10% a year in both 2015 and 2016, but would then grow at 9% a year for three years, and 4.5% thereafter. It is expected that the premium pricing strategy would improve Broadway's gross margin' to 8.5% in 2015 and 2016,9% in 2017 and 2018, and 9.5% thereafter. The task force also expected that SG&A as a percentage of revenue would remain constant at 2%, starting in 2015. Capital expenditure would be reduced to 2.1% of annual sales. Depreciation would grow by $200,000 a year. After 2020, free cash flows were assumed to grow at 4.5% annually. See Exhibit 3d for the five-year forecasts of Broadway if the acquisition takes place. Nonetheless, the task force had doubts about its assumptions regarding management and net working capital. Nor was it certain whether Broadway's account team and financial officers could manage the larger, more complex organization. Managing a combined entity double the size Broadway, with coast-to-coast operations, would be challenging. The premium pricing strategy might not work, and forecasted increases in operating margins might be too optimistic. In a pessimistic scenario, Landmark's net working capital would be 7% of sales from 2015 to 2017 and 6.5% in 2018 and thereafter. Its operating margin would reach a steady state of 2.5% by 2017 and thereafter. The premium pricing strategy might result in a 15% decline in revenue a year for Broadway, in 2015 and 2016, before it would grow again at 8% a year for three years, and at 3.5% a year thereafter - lower than the long-term growth rate of Broadway, without the acquisition. Broadway's gross margin would be 8.5% from 2015 to 2017, and 9% in 2018 and thereafter. SG&A as a percentage of sales would be 2.4% in 2015 and thereafter. All other projections would be the same as in the expected scenario. For valuation purposes, it was assumed that the acquisition will be completed by 2014 year-end. All valuations are therefore done as of end of 2014, under the assumption that 2015 will be the first year. 2 Gross margin = Gross profit as % of Revenue, where Gross profit = Revenue - COGS. Financial assets and liabilities of both firms were valued at book value for the purpose of evaluating the acquisition. The market reaction to the proposed acquisition had been mixed. Some investment banks reacted negatively to it, citing concern about whether Broadway could manage the combined business and effectively implement the proposed cost-cutting measures. Some of Broadway's board members and shareholders expressed similar views. Further, the board was unconvinced about the new pricing strategy and service model, and improvements to working capital. However, Stanley Investment Company, a major investment bank, was confident that the acquisition would benefit both companies and that financing for the acquisition could be arranged. See Exhibits 3e and 3f for the pessimistic five-year forecasts of Landmark and Broadway, respectively. The weighted average cost of capital for all calculations was estimated to be 8.5%; the tax rate used for valuation was 35%. 1. Ignore all exhibits in the case. Instead, use Exhibits 1, 2, and 3, provided in a spreadsheet available on the course website. 2. The case is being used to illustrate issues related to financing growth. Therefore, we have provided in the spreadsheet the relevant CF projections and DCF valuations for your convenience (Tables 1-6). Make sure to read the spreadsheet tab Overview which explains the information provided in each subsequent tab. You may take the analysis as given and use it to answer the questions that follow. Exhibits 2014 [Est] Exhibit 1 Landmark's Simplified Financial Statements, 2010-2014 milions, except per share data! 2010 2011 2012 2013 Income statement Revenue $289.50 $304.10 $316.40 $329.00 COGS $259,40 $273 10 $284.10 $295.30 Gross proft $30.50 531 UU 552.50 $35.0 5G&A $20.90 521 GO $26.70 $28.60 Deprecation and amart zation $1.60 $1.60 $1.70 $1.70 Operating profit $8.00 $7 80 $3.90 $3.110 Interest expense $0.00 $0.00 $0.30 $0.20 Incornic taxes $2.80 $2 73 $1.26 $1.12 Net income $2.20 $5.0/ $2.34 $2.05 CPS $1.30 $1 27 50.58 $0.52 Divided per share $0.20 $0.20 $0.20 $0.23 $345.50 $310.40 $35.10 $30.30 $1.80 $3.00 $0.00 $1.05 $105 $0.49 $0.20 All surplus Uporational Balance sheet Carli Accounts receivable Other current assets Current assets Net PP&E Investments and other assets otal assets $3.60 $20.70 $5.30 $30.60 $3.10 $45.00 $78.70 $422 $22.00 $5.10 $31 32 $5.15 $47 10 $83.57 $3.26 $29.30 $4.90 $37.16 $7.25 $47.30 $22.01 $1.52 $30.10 $5.00 $36.98 $9.17 $47.60 $93.0 $0.37 $31.00 $4.90 $35.27 11.17 $47.20 $94.64 Financial Accounts payable Link homewire Current Liabilities Deferred Laxus Other non-current liab lities Total lab litles Shareholders equity otal ab lities and equity $3.60 $0.00 $3.60 $13.90 $15.60 $35.10 $12.60 $18.70 $5.30 $0.00 $5.30 $13.90 $17 50 $36.70 $16.87 583.5/ $7.50 $4.00 $11.60 $15.50 $17.30 $43.50 $ $18.11 $42.01 $8.90 $2.50 $11.40 $15.30 $17.30 $44.00 $19.69 $93.64 $10.40 $0.00 $10.40 $15.50 $17.90 $43.80 $50.81 $94.64 irrelevant to any's Financial 2011 (Est1 Exhibit 2 Broadway's Simplified Financial Statements, 2010-2014 muillis, excep! perolulu) 2010 2011 2012 2013 Income statement Revenue $137.80 $143.50 $149.50 $155.30 COGS $_26.10 $131 50 $137.10 $142.50 Gross profit $11.79 $12 00 $12.40 $12.80 SG24 $2.90 $2.90 $2.99 $3.00 Dcorcciation and a mortization $1.80 $2 20 $2.50 $2.80 Operating profit $7.00 $6.90 $7.00 $7.00 Ieterest expense" $0.39 $0 36 $0.41 $0.39 income taxes $2.31 $2.29 $2.31 $2.31 Net nene 54.10 $425 54.75 $4.70 EPS $1.23 $1 21 $1.22 $1.23 Dividenes 50.24 SU 24 50.24 $0.24 $161.90 $148.60 $13.30 $3.00 $2.00 $7.40 $0.37 $2.46 54.57 $1.30 $0.24 $ 41 suruus Balance sheet Cas Accounts receivable Other current Assets Current assets Net & til $1.83 $13.10 52.89 $17.73 $16.00 $35.90 $69.63 $102 $13.50 $4.00 $18 52 $1.39 $38.60 $74.51 $1.99 $14.60 54.13 $20.63 $18.63 $41.89 $ $81.05 $1.50 $15.20 $4.20 $20.90 $19./1 $43.20 $83.81 $2.08 $16.20 54.70 $22.18 520.56 $43.50 $86.83 - lrII | Fisarcie! Total sets 4.Lounla payablu 59.35 $9.90 Lung LedLI, current portion $0.40 $0.40 Current Labilitics $9.79 $110.30 Long-term debt $8.20 $7 70 Deferred takes $11.60 $12.80 Other-anr.ment lisilities 511.09 $11.20 Total abilities $10.53 $42.00 shareholders equity $29.10 $32.51 Tulallabillies and equily $59.60 $ $74.51 uleresirale oli lung lemn dubloulslarding is al 4.5% per year. Print palamull. ullung-lerri debl sarru Lixed al $0.4m per year. $10.45 $0.40 $10.80 $8.79 $13.10 $12.50 $15.10 $55.55 $31.05 $11.00 $0.40 $11.40 $8.30 $13.30 $11.40 $.11.10 $29.41 $83.81 $11.50 $0.40 $11.90 $7.90 $13.00 510.9 $13.70 $43.13 586.33 irrelevant to crysis Siconca 2020 Exhibit 3a Six-year Forecast of Landmark without acquisition millions, except oer share daca 2014 2015 2016 2017 2018 lievenue growth 3.00% 5.00% 3.00% 5.00% Operating = 511) margin 1.50% 1.50X 1.50X 1.50% Wurking Capi.al 7.38% 7.38%. 7.38% 7.38% 7.38% Capex 1.00% 1.00% 1.00% 1.00% Increase in cepreciation amortization & $0.30 $0.30 $0.30 $0.30 2019 5.30 1.5UX 7.38% 1.00% $0.30 5.00% 1.30%) Revere 7.38% - Pevere 1.00% slevenue $0.33 Exhibit 3b Six-year Forecast of Broadway without acquisition (millis, excep! perahur dulu) 2014 2015 2026 2017 2018 Revenue grwth 4.04 4.0" 4.CH Operating EBIT)maran 4.0% 1.0% 1.0% 1.0% Working lapital 5.50% 9.50%. 9.50% 5.50% Capex 2.50% 2.50% 2.50% 2.50% Increase in cepreciation & amortization $0.20 $0.20 $0.20 $2.20 Interest expense $0.-10 $0.10 $0.70 $3.10 2019 40.4 10% 5.50% 2.50% $0.20 $0.10 2020 4.06 1.0% ST Revenue 5.0% verve 2.50% / Pevere $0.2 $0.13 Exhibit 3c Six-year Forecast of Landmark after acquisition - Expected (riis, cxcu!per sur le 2014 2015 2016 2017 2018 Revenue growth 5.00 5.00x 5.00'X 5.000 Operating EBIT)maran 1.50% 2.00% 2.50% 3.00% Working capital 2.38% /.00% 5.50X 6.30% b.00% Capex 1.00% 1.00% 1.00% Increase in cepreciation amortization $0.10 $0. $0.90 5.10 2019 5.00% 3.30% 5.50% 1.00% $0.30 2020 5.00 3.00% 5.-0% 1.COM 50.1 1.OCX Exhibit 3d Six-year Forecast of Broadway after acquisition - Expected imillians, except per shant data) 2014 201a Revenue growth Goss masin SG&A Viorking Capital Cape Increase in coprecation & amortization Interest expense 9.50% 2015 10.0% 8.5% 2.00% 5.50% 7.111 $0.20 $0.40 2016 10.6% 8.5% 2.CCX 5.50% 7.10 $0.20 $0.10 2017 9.06 9.0% 2.00% 5.50%: 2.10% $0 20 $0.10 2019 9.0 9.5% 2.00% 5.50% 2.1054 $0.20 $0.70 9.08 9.0% 2.00% 5.50% 7.104 $0.20 $0.10 2020 4.50% 9.50% 2.00% 5.50% 2.1046 $3.20 $3.10 5.50% 2020 Exhibit 3e Six-year Forecast of Landmark after acquisition - Pessimistic milions, except oer share data) 2014 2015 2016 2017 2018 Revenue growth J.00 5.00% Operating !EBIT) margin 1.50% 2.00% 2.50% 2.50% Vilunking Capital 7.38%. 7.00% 7.00% 7.00% 6.50% Capcx 1.00% 1.00% 1.00% 1.00 1.00 Increase in ceprecution & amortization $0.30 $0.30 $0.30 $0.30 2019 UU% 2.50% 6.50% 100% $0.30 2.50%. 6.50% 1.00% $3.30 Exhibit 3f Six-year Forecast of Broadway after acquisition - Pessimistic Imiilions, except per share data) 2014 2015 2016 2017 2018 Revenue growth -13.00% -15.00% 8.00% 8.00% Guruin 8.50% 8.50% 8.50%: 9.00% 5GKA 7.401"} 7.40% 7.40* Verkin Capital 5.50% 5.50% 5.50% 5.50% 5.50% Capex 2.10' 2.10% 2.10% 2.10% Increase in ceprecat on & amortization $0.20 $0.20 $0.20 $0.20 Interest expense $0.40 $0.40 $0.40 $0.40 7.4016 2019 8.00 9.00% 74044 5 50% 2 10% $0.20 $0.40 2020 3.50%, 9.00% 7.4074 5.50% 2.10% $0.20 $0.40 Cummion dala (both firrris, pre- and post-acquisition, cxpccted and pessimistic) WACC 8.50% Fax rate 35.00%Step by Step Solution
There are 3 Steps involved in it
Step: 1

Get Instant Access to Expert-Tailored Solutions
See step-by-step solutions with expert insights and AI powered tools for academic success
Step: 2

Step: 3
Ace Your Homework with AI
Get the answers you need in no time with our AI-driven, step-by-step assistance
Get Started
Pricing And Hedging Financial Derivatives A Guide For Practitioners
Authors: Leonardo Marroni, Irene Perdomo
1st Edition
1119953715, 978-1119953715