

Answered step by step
Verified Expert Solution
Question
1 Approved Answer
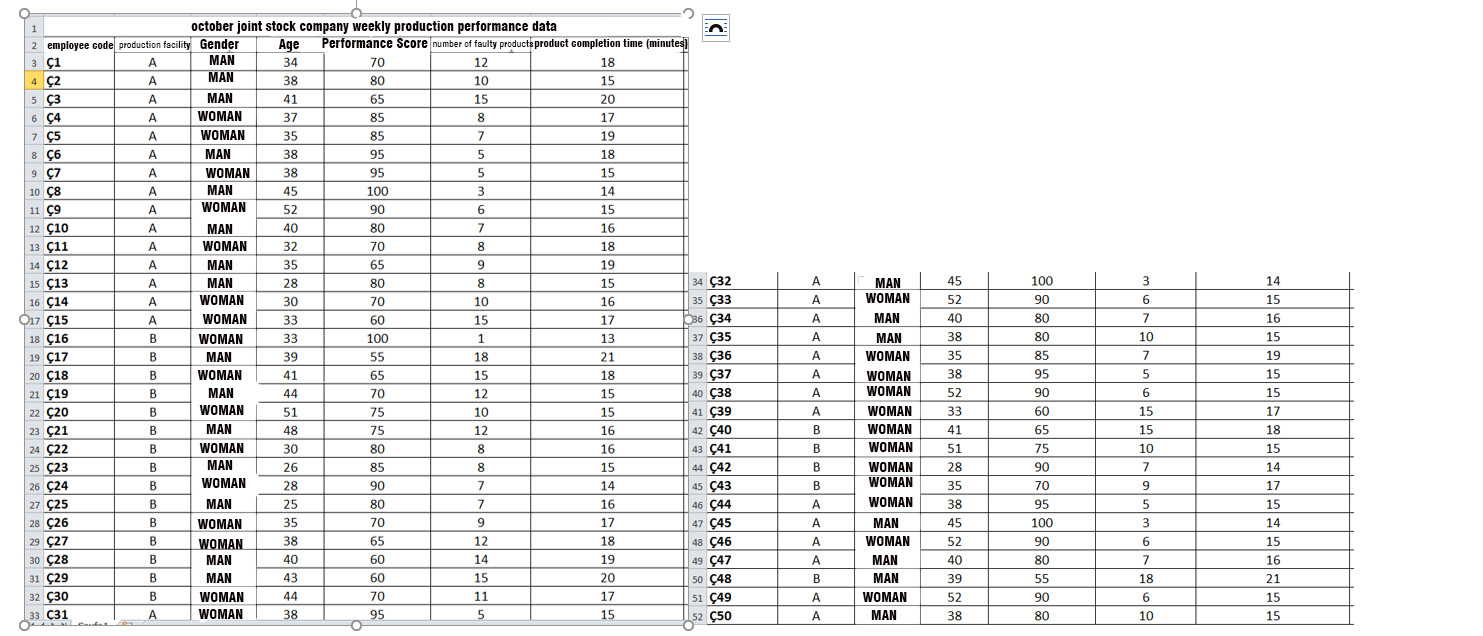
Answer the first question by choosing the desired 15 rows (15 employees) from the above data set. Here, the rows to be selected should be
Answer the first question by choosing the desired 15 rows (15 employees) from the above data set. Here, the rows to be selected should be personalized. You can choose whatever you want.
1. Calculate and interpret the appropriate descriptive statistics according to the measurement levels (nominal, ordinal, interval-ratio) of the variables in the data set.
[Descriptive statistics: Means (Arithmetic, Geometric, Squared) Variability measures: Range of Variation, Average Deviation, Standard Deviation, Coefficient of Variation)
Step by Step Solution
There are 3 Steps involved in it
Step: 1

Get Instant Access to Expert-Tailored Solutions
See step-by-step solutions with expert insights and AI powered tools for academic success
Step: 2

Step: 3
Ace Your Homework with AI
Get the answers you need in no time with our AI-driven, step-by-step assistance
Get Started