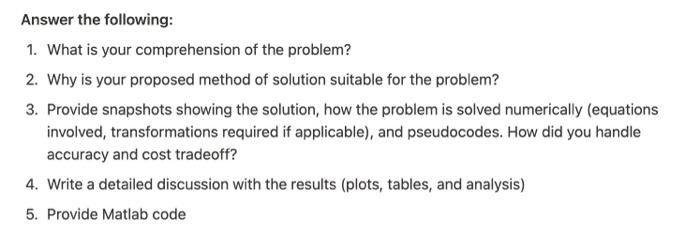
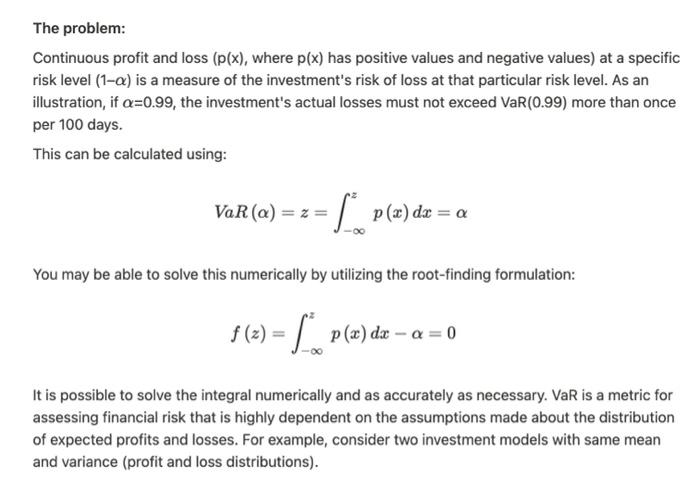
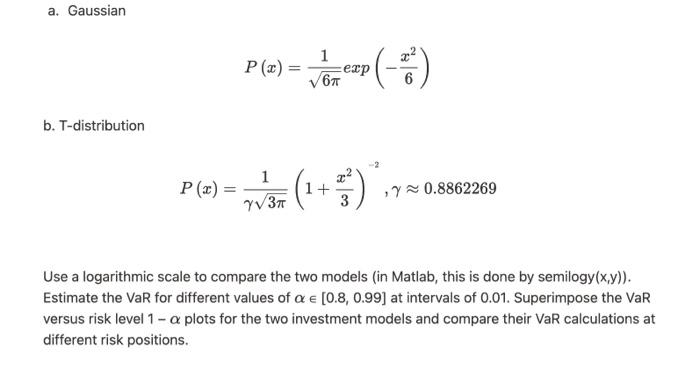
Answer the following: 1. What is your comprehension of the problem? 2. Why is your proposed method of solution suitable for the problem? 3. Provide snapshots showing the solution, how the problem is solved numerically (equations involved, transformations required if applicable), and pseudocodes. How did you handle accuracy and cost tradeoff? 4. Write a detailed discussion with the results (plots, tables, and analysis) 5. Provide Matlab code The problem: Continuous profit and loss (p(x), where p(x) has positive values and negative values) at a specific risk level (1-x) is a measure of the investment's risk of loss at that particular risk level. As an illustration, if a=0.99, the investment's actual losses must not exceed VaR(0.99) more than once per 100 days. This can be calculated using: VaR (a): =Z= - p(x) dx = a You may be able to solve this numerically by utilizing the root-finding formulation: (z) = p(x) dx - a = 0 It is possible to solve the integral numerically and as accurately as necessary. VaR is a metric for assessing financial risk that is highly dependent on the assumptions made about the distribution of expected profits and losses. For example, consider two investment models with same mean and variance (profit and loss distributions). a. Gaussian 1 P(x)= exp 6 (-) b. T-distribution 1 P(x)= -/ = ( + =) . ,7 0.8862269 Y3 3 Use a logarithmic scale to compare the two models (in Matlab, this is done by semilogy(x,y)). Estimate the VaR for different values of a [0.8, 0.99] at intervals of 0.01. Superimpose the VaR versus risk level 1 - a plots for the two investment models and compare their VaR calculations at different risk positions. Answer the following: 1. What is your comprehension of the problem? 2. Why is your proposed method of solution suitable for the problem? 3. Provide snapshots showing the solution, how the problem is solved numerically (equations involved, transformations required if applicable), and pseudocodes. How did you handle accuracy and cost tradeoff? 4. Write a detailed discussion with the results (plots, tables, and analysis) 5. Provide Matlab code The problem: Continuous profit and loss (p(x), where p(x) has positive values and negative values) at a specific risk level (1-x) is a measure of the investment's risk of loss at that particular risk level. As an illustration, if a=0.99, the investment's actual losses must not exceed VaR(0.99) more than once per 100 days. This can be calculated using: VaR (a): =Z= - p(x) dx = a You may be able to solve this numerically by utilizing the root-finding formulation: (z) = p(x) dx - a = 0 It is possible to solve the integral numerically and as accurately as necessary. VaR is a metric for assessing financial risk that is highly dependent on the assumptions made about the distribution of expected profits and losses. For example, consider two investment models with same mean and variance (profit and loss distributions). a. Gaussian 1 P(x)= exp 6 (-) b. T-distribution 1 P(x)= -/ = ( + =) . ,7 0.8862269 Y3 3 Use a logarithmic scale to compare the two models (in Matlab, this is done by semilogy(x,y)). Estimate the VaR for different values of a [0.8, 0.99] at intervals of 0.01. Superimpose the VaR versus risk level 1 - a plots for the two investment models and compare their VaR calculations at different risk positions


