Answered step by step
Verified Expert Solution
Link Copied!

Question

1 Approved Answer

answer the following questions 4. The frequency table gives the ages in years of a sample of 65 people. (5) (a) Find the sample mean.

answer the following questions
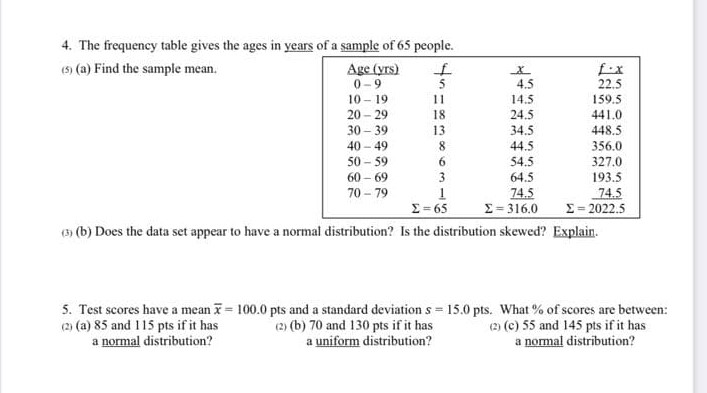
image text in transcribed
4. The frequency table gives the ages in years of a sample of 65 people. (5) (a) Find the sample mean. Age ( yrs) 0-9 Cut 4.5 22.5 10 - 19 14.5 159.5 20 - 29 18 24.5 441.0 30 - 39 13 34.5 448.5 40 - 49 8 44.5 356.0 50 -59 6 54.5 327.0 60- 69 64.5 193.5 70 - 79 74.5 74.5 E = 65 E=316.0 E = 2022.5 ((b) Does the data set appear to have a normal distribution? Is the distribution skewed? Explain. 5. Test scores have a mean x = 100.0 pts and a standard deviation s = 15.0 pts. What % of scores are between: () (a) 85 and 1 15 pts if it has (2)(b) 70 and 130 pts if it has () (c) 55 and 145 pts if it has a normal distribution? a uniform distribution? a normal distribution

Step by Step Solution

There are 3 Steps involved in it

Step: 1

blur-text-image

Get Instant Access to Expert-Tailored Solutions

See step-by-step solutions with expert insights and AI powered tools for academic success

Step: 2

blur-text-image

Step: 3

blur-text-image

Ace Your Homework with AI

Get the answers you need in no time with our AI-driven, step-by-step assistance

Get Started

Recommended Textbook for

Saxon Algebra 1/2 An Incremental Development, Test Forms

Authors: Saxon Publishers

3rd Edition

9781591411734, 1591411734

More Books

Students also viewed these Mathematics questions